

What you are about to read:
TradingView website have gained significant popularity among traders and investors in recent years. This website serves as an advanced analytical system, providing powerful charting tools, analysis, and data that focus on a wide range of financial instruments. For those who have recently become acquainted with the TradingView website, this platform may initially seem challenging. However, with a little guidance and practice, even beginners can effectively benefit from this tool to enhance their trading skills.
TradingView, as one of the most advanced platforms in financial markets in terms of technology and the digital currency sector, has transformed into a giant with a value exceeding one trillion dollars. Tools such as automated trading using advanced robots and complex technical analysis based on sophisticated strategies dominate this industry, encouraging all traders to explore these exciting new tools.
In this Forex BrokerLand article, we delve into the basics of TradingView tutorial and how to get started with this powerful platform. We will cover the features that distinguish this site from other trading tools, types of charts in Forex, available Forex indicators, and how to effectively use these tools for market analysis.
Getting Started with TradingView
The first step in the TradingView tutorial is to register for an account on the platform. Creating an account is quick and easy, and after registration, you will have access to a wide range of charts and market data. The use of this platform is free, but there are also paid subscription plans that offer additional features and functionalities.
After registering for an account, you can start exploring the platform and familiarizing yourself with its features. One of the best ways to do this is by creating your first chart. Simply choose a financial instrument from the dropdown menu at the top of the page, such as a currency pair or stock. Then, select the chart timeframe, such as daily or weekly.
Once you’ve chosen the symbol and timeframe, you’ll see a chart on the screen. This chart displays the price action of the selected instrument in the chosen timeframe, along with any indicators or overlays you’ve added. You can customize your chart by changing the background color, color scheme, and chart type (such as candlestick or line).
TradingView Features
One key feature that sets TradingView apart from other trading tools is its social trading community. It allows users to share their ideas and analyses with others, as well as follow and see what other traders are doing in the market. This makes TradingView an excellent platform for learning and sharing knowledge about trading.
Another powerful feature of the this website is its charting tools. The platform provides a wide range of indicators and overlays that traders can use for market analysis.
These include popular indicators such as moving averages, MACD, and RSI, as well as more advanced indicators like Ichimoku and Bollinger Bands. Traders can also create custom indicators using the Pine Script programming language.
In addition to charting tools, TradingView provides real-time market data for a broad spectrum of financial instruments, including stocks, currencies, commodities, and digital currencies. Traders can view prices, quotes, as well as forex data and news.
Whether you are a beginner or an experienced trader, using a TradingView account can help you become a better forex trader. Opening a demo account for forex trading is a simple process and can be completed in a few easy steps, as BrokerLand guides you in this article. Feel free to share your comments and questions below this article for further assistance.
Basic TradingView Tutorial
Exploring this platform is highly valuable for those interested in technical analysis. TradingView provides a free practice environment equipped with essential tools, making it a valuable asset for honing investment skills. For example, discovering Fibonacci retracement complexities in its charts is a fundamental step in mastering price prediction techniques extensively.
In the leftmost section of the TradingView terminal, a set of graphical tools is available and highly impactful. Let’s review key buttons in this menu:
Line Drawing: Encompasses simple lines, curves, and Fibonacci retracement corrections. Analysts use these tools to predict future support and resistance levels for various assets.
Prediction and Measurement Tools: Facilitate assessing potential dynamicity when entering orders, aiding in strategically choosing profit and stop-loss points.
Technical Analysis Patterns: Specialized graphical overlays that offer various functions, including predicting reversals and identifying future support and resistance levels.
Now, let’s use the Fibonacci retracement correction tool in TradingView charts for technical analysis. This technique involves using two ends of a chart to predict potential support and resistance prices for a specific asset. Distinguished lines, often marked with Fibonacci sequence numbers (61.8%, 50%, 38.2%, and 23.6%), indicate significant price levels.
For descending prices, the Fibonacci retracement correction involves the following steps:
- Identify the maximum and minimum price points on the chart.
- Start drawing a Fibonacci retracement from the maximum to the minimum.
- Adjust its length to the desired width.
Once completed, the chart displays potential support and resistance levels for the asset. It’s important to note that this process is reversed for ascending charts and requires drawing in the opposite direction.
Types of Charts and Indicators
TradingView offers various types of charts, each with its unique features and advantages. These include line charts, bar charts, and candlestick charts.
Line charts are the simplest type, showing the closing price of an instrument within a specific time frame. Bar charts are similar to line charts but also display open, high, and low prices. Candlestick charts are the most popular, providing similar information to bar charts but with a visually appealing design.
TradingView also provides a wide range of indicators and overlays that traders can use for market analysis. These indicators include trend indicators, momentum indicators, and volume indicators. Trend indicators help traders identify the direction of the trend, while momentum indicators show whether the trend is gaining or losing momentum. Volume indicators help traders identify the strength of the trend by showing trading volume.
Some of the popular indicators on TradingView include moving averages, Relative Strength Index (RSI), and Moving Average Convergence Divergence (MACD). Moving averages assist traders in identifying the overall trend by smoothing price fluctuations in a specific time frame.
RSI is a momentum indicator that measures the strength of price movements, while the Moving Average Convergence Divergence (MACD) helps traders identify overbought and oversold conditions in the market. TradingView also offers more advanced indicators such as Ichimoku Cloud, Bollinger Bands, and Fibonacci retracement.
Ichimoku Cloud, Bollinger Bands, and Fibonacci retracement are more advanced indicators that provide additional insights into market trends and potential reversal points.
How to Read Charts on TradingView
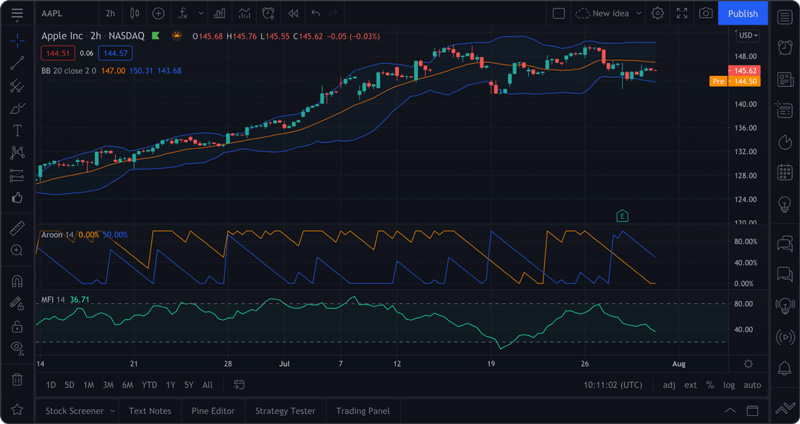
Learning TradingView involves understanding how to interpret price charts. After initial exploration, the platform may present a complex menu with numerous buttons scattered across the top, left, and right panels. Despite its apparent complexity, decoding the information becomes straightforward with a careful eye.
At the heart of this platform is the price chart, displaying a dynamic interaction of candlesticks. Examining the key components, we find:
Vertical Axis (Price)
The Y-axis represents the price, adjustable by holding the left-click and moving the mouse or scrolling. The price range varies for different assets, reflecting their distinct values. For example, while 1 Bitcoin may surpass $30,000, 1 ETH could be under $20,000.
Horizontal Axis (Time Scale)
Similar to the price axis in TradingView, the X-axis, representing time, is adjustable. By default, it adapts to changes in the selected timeframe. Common timeframes include 1, 3, 5, 15 minutes, or hourly and daily intervals.
Candlesticks
Candlesticks in TradingView depict the dynamic of prices, with each candle’s body representing open and close prices within the chosen period. The shadows, thin lines above and below, indicate the highest and lowest prices of the period. Drawing a line through the centers of candlesticks creates an average price indicator.
TradingView incorporates several tools that affect the displayed information, accessible in the top menu. Key elements in the top menu, from left to right, include:
- Profile Management: Identified by an icon showing your image and the initial letter of your username, this button opens the main menu for profile settings.
- Symbol Search: A symbol selector aiding in the search for desired assets and related data resources. Typing “BTC” might show multiple options for Bitcoin trading pairs.
- Time Scale: Facilitates seamless switching between standard timeframes, adjustable based on personal preferences.
- Chart Type: Enables switching between various chart types like Renko, Line, Bars, and more.
- Indicators and Templates: Provides access to a catalog of analytical tools commonly used in technical analysis.
- Alerts: Adjustable signals for significant market events, price fluctuations, or specific indicator values.
- Replay: Allows inspection of past price chart data, facilitating strategy testing before real-world use.
Mastery of these tools equips you with the skills to extract valuable insights about prices using charts effectively as you learn TradingView.
Using the Feature of Applying Strategies on TradingView
The effective use of TradeView strategies, thanks to a collection of specialized tools and user-generated strategies available to you, is crucial for millions of traders. Additionally, the integration of this feature with services like automated trading, such as WunderTrading, adds another layer of attractiveness to the features of this site. While automated trading is a topic for later discussion, let’s focus on the TradingView tutorial for using strategy options.
Here is a simple, step-by-step guide:
- Click on “Indicators” located in the top menu of the TradingView terminal.
- Go to the tabs above the list of indicators and select “Strategies.”
- Choose the desired strategy from the newly presented list.
- If your preferred strategy is not immediately visible, use the search bar to find it.
That’s it. By selecting a strategy, you will see its application on the price chart. Furthermore, understanding how to use multiple charts on TradingView can be helpful. Some strategies may require a cross-comparison with price data from other assets.
To do this:
- Click on the plus sign next to the name of the initially viewed asset.
- Select the relevant asset from the list or use the search feature.
The selected charts will be overlaid, providing a comprehensive view of prices for comparing them with other assets.
Automated Trading on TradingView
TradingView stands out as a premier platform for automated trading, offering various ways to achieve this through APIs and the Pine Editor. Companies like WunderTrading utilize this technology, ensuring their customers can harness the full potential of the world’s most popular charting tools.
Automation serves as a tool for traders to expedite or execute various forex order types instantly, eliminating idle time and decision-making when entering the market. To do this:
- Select a strategy on the TradingView platform.
- Create an alert script.
- Wait for an alert to appear.
- Go to your exchange and execute the order.
- Wait for the order to be confirmed.
However, manual execution involves time-consuming steps, including analyzing the next move, navigating between tabs or browser windows, adjusting values, and setting precise stop-loss and take-profit levels. For day traders relying on quick reflexes, this process poses challenges and potentially causes them to miss opportune market entry points. Automation resolves this issue:
- A TradingView script generates an alert.
- A robot swiftly receives and processes the alert, sending commands to an exchange.
- The exchange rapidly executes the commands as per your preferences.
This entire process happens within a few seconds or fractions of a second, providing a streamlined and efficient approach to trading.
Types of accounts on TradingView
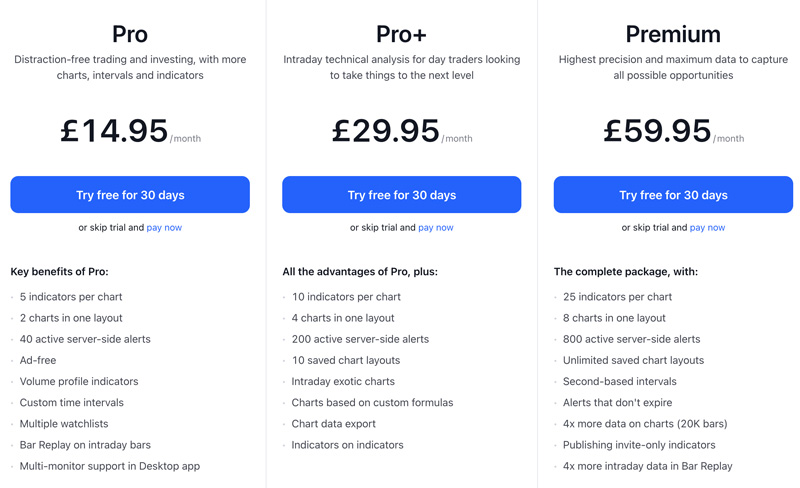
The accounts on the TradingView website are divided into four categories, one of which is free, and the others are paid. For each non-free plan, a one-month training course is provided to traders. It is worth noting that the cost of these paid accounts is much lower compared to other competitors on this website.
General or Free Account
This type of account on the TradingView website is suitable for beginners or those who want to familiarize themselves with the platform’s functionality. However, its features are more limited compared to other accounts. With this account, you have access to news and the social network but do not receive support.
Pro Account on TradingView
The professional account on TradingView provides slightly more features, but you still only receive one chart layout and can use only one device simultaneously. This plan offers ten alerts and five indicators per chart but does not include perpetual access to customer services or SMS notifications.
Pro Plus Account
In this type of account, TradingView offers better services to customers. Unlike the previous two plans, you can use two devices simultaneously. Additionally, more alerts and the ability to use four charts are among the features of this account.
Premium Account
The premium plan on TradingView provides users with all the features and capabilities of the platform. Some of these features include the ability to receive eight layouts per chart, unlimited access to indicators, and 200 alerts. Permanent support is also included for users of this account.
Summary of TradingView Tutorial
In this Brokerland article to learn forex, TradingView tutorials aim to introduce this platform to users. For effective use of this site, having a clear trading plan and strategy is important. Traders should define entry and exit points and their risk management plan before entering any trade.
The platform can be a powerful tool for identifying potential trading opportunities and analyzing market trends. However, it should always be used alongside a robust trading plan. One of the best ways to utilize TradingView is by following other traders and analysts on the platform.
This website has a large community of traders and investors who share their analyses and ideas. Following other traders and analysts can be an excellent way to learn about new trading strategies and techniques and gain valuable insights.


