

What you are about to read:
Countless ways exist for trading in the forex market, from fundamental analysis to using forex experts and strategies like MACD and Stochastic. Among the chart patterns used to interpret price trends, this article from Brokerland aims to provide education on the flag chart pattern.
This pattern is recognized for its ability to offer valuable insights into price movements and can be used for executing profitable trades. Stay with us until the end of this text to become familiar with how to use this pattern in trades.
Flag Chart Pattern
Technical analysis plays a crucial role in most trading strategies, and traders heavily rely on various techniques to make informed investment decisions. Chart patterns in forex, such as the triangle chart pattern and flag pattern, are among the first technical analysis techniques that traders learn.
These patterns frequently appear in all markets and timeframes and are known by various names. Knowing how these patterns look and what the flag pattern strategy is to trade them is an essential skill that both novice and professional traders use.
The flag chart pattern is a type of technical pattern that occurs when a currency pair experiences a sharp price movement, followed by a consolidation period. During the consolidation period, the price of the currency pair moves within a narrow range, forming a rectangle or flag shape. When the consolidation period ends, the price of the currency pair usually breaks in the same direction as the initial price movement, resulting in a strong trend.
The flag pattern is used to identify the continuation of a previous trend from the point where the price moved against it. If the trend resumes, the price increase can be rapid, providing an opportunity for traders to better time their trades when they recognize the pattern.
In fact, these patterns are created when the price pauses for a short period and moves against the direction of the previous trend, whether it be upward or downward.
Types of Flag Patterns in Forex
Bullish and bearish flags are popular price patterns recognized in technical analysis, and traders often use them to identify trend continuations. Before introducing and teaching the bearish and bullish flag patterns, we should know that these are price patterns that often occur in different timeframes in financial markets and are considered as trend continuation patterns in technical analysis. There are two types of flag chart patterns:
- Bullish flags
- Bearish flags
The bullish flag pattern occurs when the initial price movement is upward, followed by a consolidation period. On the other hand, the bearish flag occurs when the initial price movement is downward, followed by a consolidation period.
Bullish Flag Pattern Tutorial
The chart below illustrates a bullish flag.
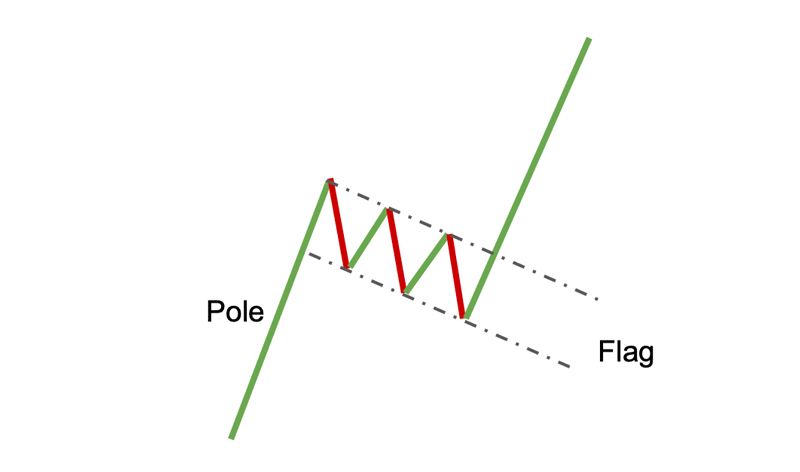
When prices are in an uptrend, a bullish flag pattern, following an aggressive uptrend, indicates a slow consolidation. This pattern suggests that there is more buying pressure, pushing prices higher. It also indicates the continuation of this movement and the upward trend in the market. Traders, upon observing this pattern, wait for prices to break above the resistance before entering the market.
Bearish Flag Pattern Tutorial
Regarding the tutorial on the bearish flag, it should be noted that this pattern essentially appears as an inverted version of the bullish flag.
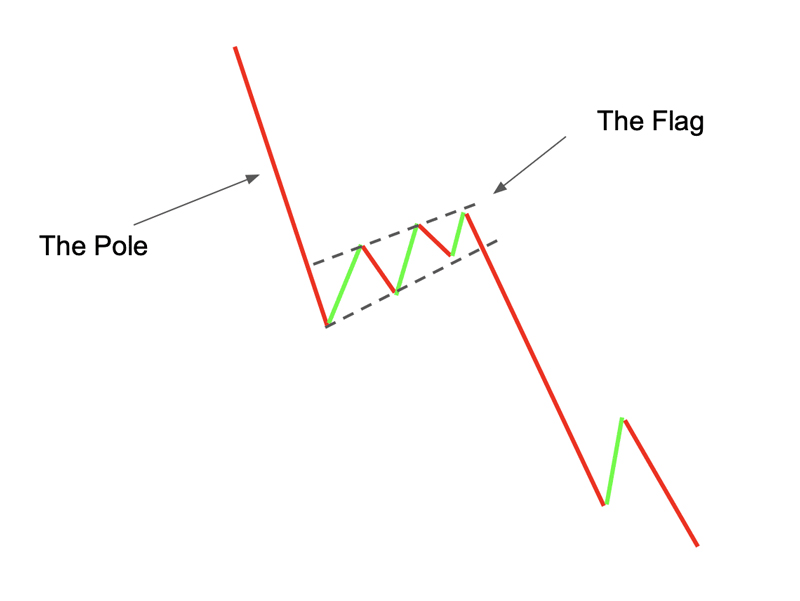
When prices are in a downtrend, a bearish flag, following an aggressive downtrend, indicates a slow consolidation. This pattern suggests that there is more selling pressure, causing prices to decrease, and it indicates that the movement in a downtrend will continue.
Traders, upon observing this pattern, wait for prices to break below the support level to take a short position.
Flag Chart Pattern Strategy
What follows is a simple trading strategy that involves a volume indicator to help identify the flag pattern with high probability. Traders who follow this pattern often choose between aggressive or conservative entry approaches. Aggressive traders may decide to take a short position as close as possible to the upper resistance line with a tight stop-loss.
The entries and aggressive decisions are often more dangerous, as is the case with this example, because you certainly don’t know that the flag chart pattern has ended unless you rely on additional analysis methods to confirm that the pattern may be nearing its end.
Therefore, we place the volume indicator in the bottom panel of the chart. During the trend phase, the volume usually increases, as is also the case in this example. However, in the flag stage, the volume slowly decreases. This indicates that the pattern is approaching its end, and the volume decrease serves simply as an additional confirmation method.
Traders who follow a conservative entry method first wait for the price to break and close below the lower support line and then enter a position. With this approach, one can again use the flag-pole height to find a target level (the green angled line and the horizontal line) predicted to be lower than the entry price. A stop loss can be placed above the previous peak formed at the upper resistance line.
Although the conservative approach relies initially on confirming the price’s exit from the pattern, traders following this approach often use an additional confirmation signal from a forex indicator such as the volume indicator.
Two examples of flag pattern and its trading strategy
Now let’s examine two examples of these patterns.
Example 1: Bullish flag
The chart in the first example shows a bullish flag chart pattern formed on a daily timeframe. Note how the volume increased before the formation of the flag but decreased while the price was trading between the upper resistance lines and the lower support.
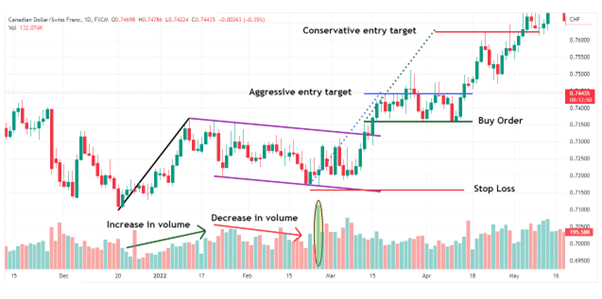
This example is a good illustration of how trading volume can assist a trader in deciding about the continuation of the trend after the end of the bullish flag pattern. Another clue that the consolidation phase is nearing its end appeared when the price, with a significant increase in buying volume (yellow oval on the volume panel), went above the lower support line, increasing the likelihood of the consolidation phase ending.
In this example, both aggressive and conservative entry methods will quickly reach their targets.
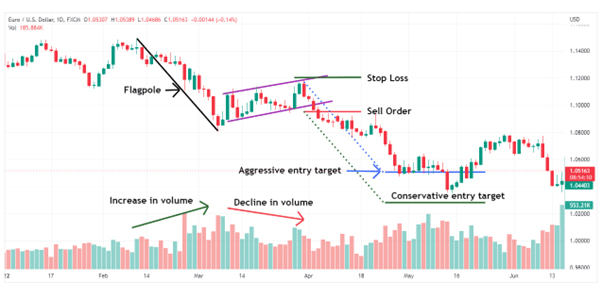
Example 2: Bearish flag
The second example depicts a bearish flag chart pattern, but this time on a 30-minute timeframe. The demonstration that this pattern can appear in any time frame makes it an excellent pattern to follow regardless of your trading style.
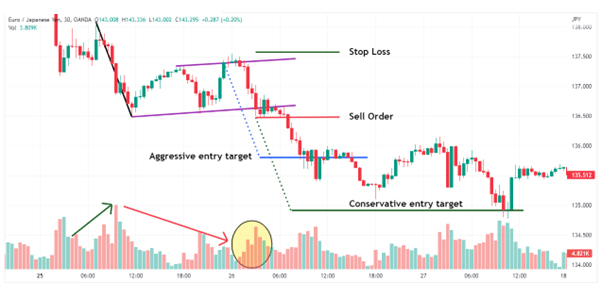
Here too, the volume increased before the formation of the flag, but while the price was trading between the resistance and support lines, it decreased. Even on the 30-minute timeframe, after the price reached the upper resistance line, the volume started to increase again, indicating that the downward trend has resumed.
Summary
In this article to learn Forex, we covered the flag chart pattern, which is a very popular chart pattern included in traders’ trading strategies regardless of their experience levels. Identifying this pattern is not only easy but the breakout that occurs after completing this pattern often leads to a strong continuation move that can quickly reach the trader’s targets.
There are two types of flags: bullish and bearish. The bullish pattern occurs when the initial price movement is upward, followed by a consolidation period. On the other hand, the bearish pattern occurs when the initial price movement is downward, followed by a consolidation period.
By practicing this pattern strategy, preferably with a demo account, you can improve your skills over time and, with full mastery, incorporate this approach into your trades.


