

What you are about to read:
As you know, the world of forex trading involves various strategies and methods, ranging from martingale and anti-martingale strategies to price action and price action RTM. Even the use of artificial intelligence in forex for trading and income generation exists. Knowing them helps you use the appropriate method in any market condition. In this article to learn forex with Brokerland, we will focus on teaching trading with the triangle chart pattern, which is one of the commonly used strategies in forex.
One of the popular trading strategies in the forex market is the triangle pattern strategy, which is a technical analysis pattern that occurs when the price of a currency pair moves in a triangle. This pattern is useful because it shows traders when to enter and exit trades. Stay with us until the end of this article to learn about the types of these patterns and how to trade them.
What is a triangle chart pattern?
The triangle pattern is a technical analysis pattern that occurs when the price of a currency pair moves in a triangle, and there are three types:
- Symmetrical triangle
- Ascending triangle
- Descending triangle
Before delving into the triangle pattern strategy, it’s important to know that this pattern is a consolidation one that occurs in the middle of a trend and usually indicates the continuation of the existing trend. It forms by drawing two converging trend lines while the price temporarily moves sideways. Traders often look for the next breakout in the direction of the previous trend as a forex signal to enter a trade.
This article uses linear chart images to present triangular chart patterns. Traders should familiarize themselves with three technical analysis chart patterns and understand which one is more suitable for them, although most prefer using forex candlestick charts. For a more in-depth review and understanding of these chart types, you can read the article on charts in forex, which was previously published on the site.
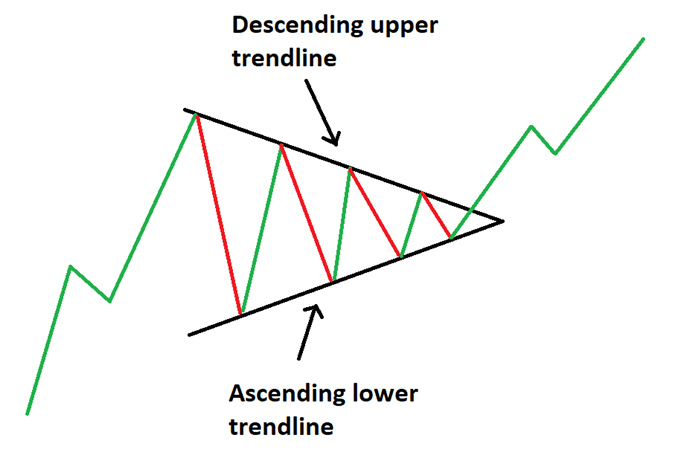
Symmetrical Triangle Pattern
The symmetrical triangle chart pattern can be considered as the starting point for all triangle pattern variations. As its name suggests, a triangle is seen on the chart after drawing two converging trendlines. In fact, the symmetrical pattern occurs when the price of a currency pair moves within a triangle that has two converging trendlines.
The difference between the symmetrical pattern and other triangles is that the symmetrical one is a neutral pattern and does not lean in any direction. While the triangle itself is neutral, it still prefers the direction of the existing trend, and traders are looking for a breakout in the direction of the trend. This triangle chart pattern indicates a period of uncertainty in the market, as traders are unsure whether the price will go up or down.
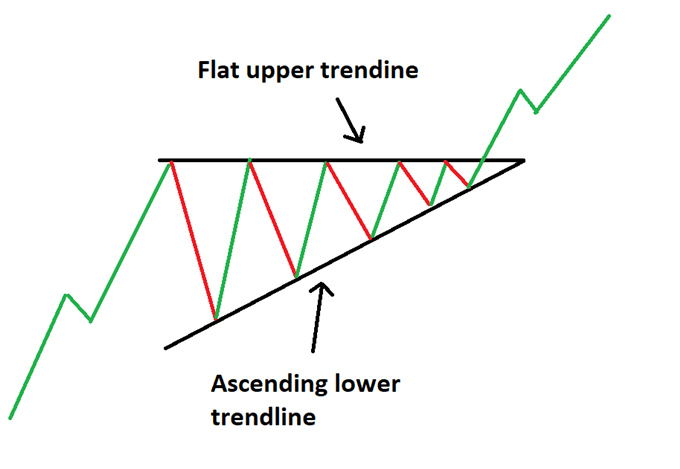
Ascending Triangle
The ascending triangle pattern occurs when the price of a currency pair moves within a triangle that has a horizontal resistance line and an ascending support line. The ascending triangle pattern indicates that buyers are more active than sellers, as the price moves towards the resistance line.
Trading this triangle chart pattern is similar to the symmetrical triangle, with the difference that the upper trendline is flat, while the lower trendline is ascending. For this reason, it is said that this pattern shows that buyers are more aggressive than sellers, as the price continues to its highest limit. The price approaches the flat and upward trendline, and with more evidence, the likelihood of ultimately breaking the triangle and moving upward increases.
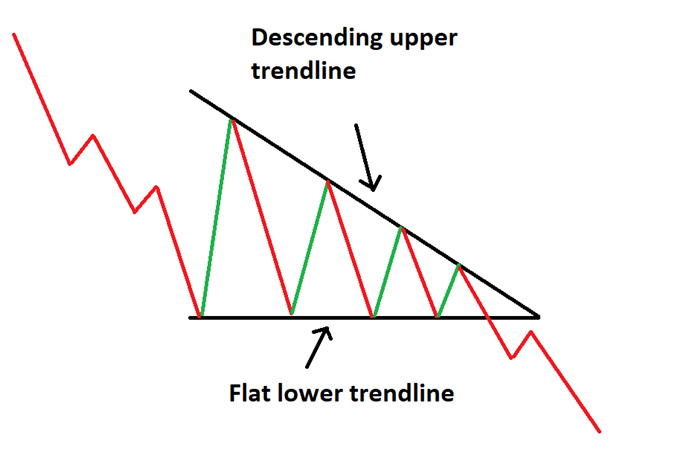
Descending Triangle Pattern
On the other hand, the descending triangle pattern is characterized by a descending upper trend line and a flat lower trend line. It occurs when the price of a currency pair moves within a triangle that has a horizontal support line and a descending resistance line. This descending pattern indicates that sellers are more active than buyers, as the price moves towards the support line.
In other words, sellers are more aggressive than buyers as the price continues to its lowest limit. The price approaches the descending support line, and with more evidence, the likelihood of ultimately breaking the triangle and moving downward increases.
How to Trade the Triangle Pattern?
The triangle pattern strategy requires a bit of patience and discipline. The first step is to identify the pattern on the chart. Once the pattern is identified, you must wait for a breakout. A breakout occurs when the price of the currency pair moves above or below one of the trendlines in this pattern. The breakout indicates that the market has made a decision about the price direction.
To trade the triangle chart pattern, you should wait for the breakout and then enter a trade in the direction of the breakout. For example, if the price breaks above the resistance line in an ascending, you will enter a long (buy) trade.
When trading with this method, it’s important to set a stop-loss order, which is one of the types of forex orders, to limit your losses and prevent getting stopped out and margin calls if the market moves against you. You should also set a profit target so that you can capture your profits as long as the trade goes in your favor. Below, we explain the strategy of using various introduced patterns.
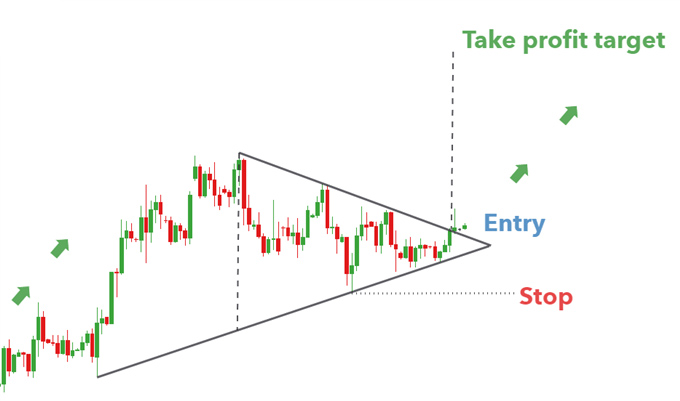
Symmetrical Triangle Pattern Strategy
Triangles provide an effective breakout measurement technique, which can be adapted and applied to other variations. The chart of AUD/USD below shows a symmetrical triangle. The vertical distance between the upper and lower trendlines can be measured and used to predict a suitable target when the price breaks out of the symmetrical triangle.
It is essential to note that finding a complete symmetrical triangle is very rare, and traders should not be too hasty in invalidating incomplete patterns. They should understand that the analysis and trading with the triangle pattern are less about finding perfect patterns.
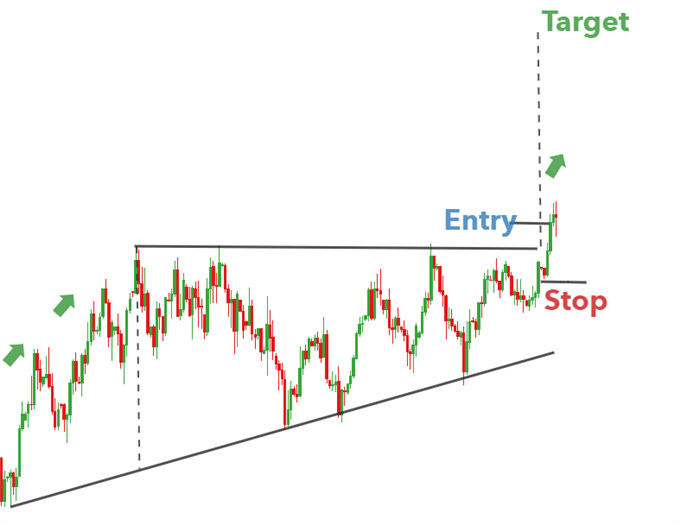
Ascending Triangle Strategy
Below, you can observe an ascending triangle in the US Dollar Index. With the prevailing uptrend, there is a period of consolidation forming the ascending triangle. Traders can once again measure the vertical distance at the beginning of the triangle formation and use it at the breakout point to predict the profit level. In this example, to mitigate downside risk, a stop-loss can be placed at the recent low volatility.
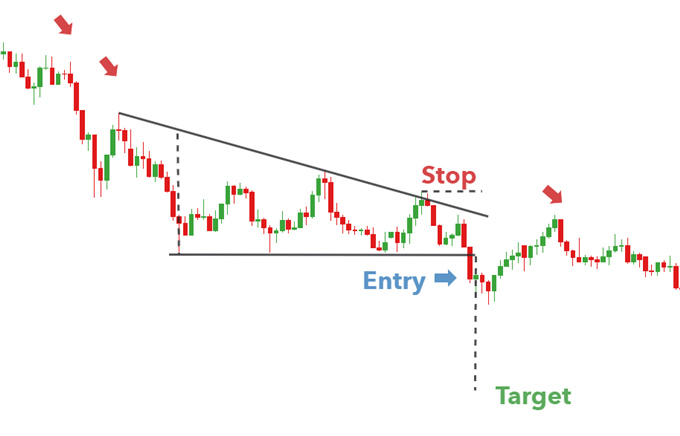
Descending Triangle Chart Pattern Strategy
Below is a good example of a descending pattern appearing in GBP/USD. A downtrend leads to a consolidation period where sellers dominate over buyers, gradually pushing the price lower. A strong breakdown below the lower trendline provides traders with an opportunity to go short.
In this example, it doesn’t take much time for the position to move in the opposite direction, emphasizing the importance of setting an appropriate stop-loss. The profit target is also set using the measured vertical distance at the beginning of the descending triangle formation.
Note: This description is for illustrative purposes only and should not be considered financial advice. Traders should conduct thorough analysis and consider their risk tolerance before making any trading decisions.
Tips for Trading the Triangle Patterns
Here are some points for trading this pattern:
- Use other forex indicators: The triangle chart pattern is just one tool in your trading arsenal. You should also use other indicators like moving averages to confirm the breakout.
- Always be aware of the trend before the consolidation period.
- Be patient: The development of the triangle pattern may take some time. Before entering a trade, be patient and wait for the pattern to form.
- Use proper risk management: Always use proper risk management when trading with this strategy. This means setting a stop-loss order and a take-profit limit and using an appropriate risk-to-reward ratio.
- Use upper and lower trendlines to help identify and trade this pattern.
- Use multiple time frames:Look at the pattern on multiple time frames to get a better idea of the overall trend. This is known as multi-timeframe analysis.
- Look for additional confirmations: Look for other factors that confirm the breakout, such as trendlines or support and resistance levels.
Summary
In summary, in this article from Brokerland, we explained that the triangle pattern is a useful tool for forex traders looking to identify potential trading opportunities. These patterns come in three main types and often appear in the forex market. These patterns provide traders with more insight into future price movements and the likelihood of a trend continuation. However, not all triangle shapes can be interpreted the same way, which is why understanding each pattern separately is essential.
This pattern provides a clear signal for entry and exit times in trades. To trade the triangle chart pattern, you should be patient and disciplined. Always use proper risk management and look for other indicators that confirm the breakout. Considering these points, you can have a successful trade.


