

What you are about to read:
The Pivot Point indicator is a technical indicator used by traders in the Forex market to determine potential support and resistance levels. The Point itself is simply the average of the high, low, and closing prices from the previous trading session. From this point, several other support and resistance levels can be calculated. In this article from Brokerland, we will explore the basic principles of Pivot Points in Forex trading, including how to calculate them and how to use them in trading strategies.
Understanding Pivot Points
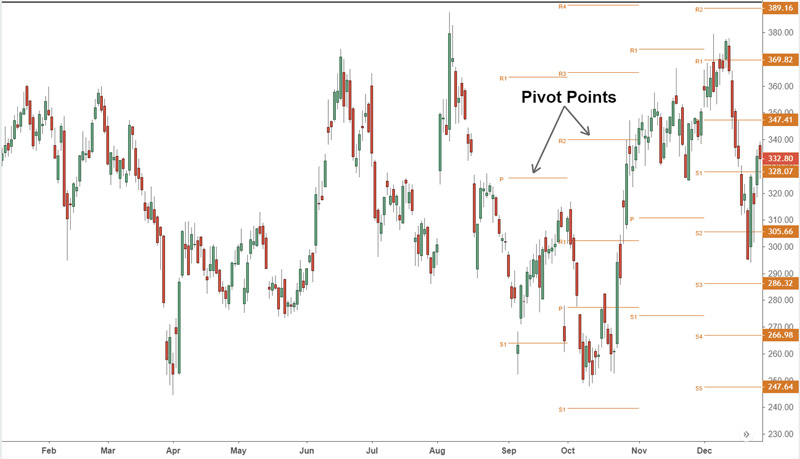
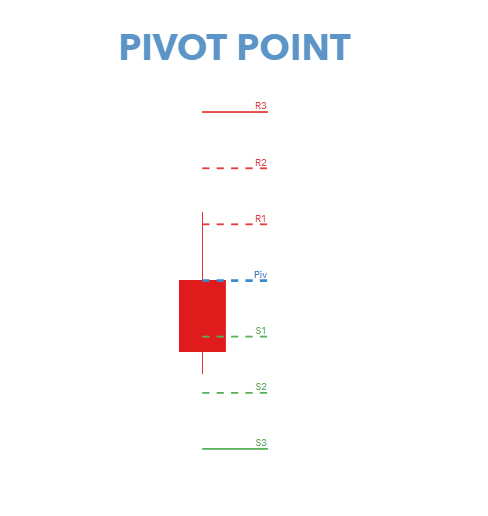
As mentioned earlier, the Pivot Point is the average of the previous Forex session’s high, low, and closing prices. This is often referred to as the “base” Pivot-Point. Three other support and resistance levels can be calculated from this point.
The first support and resistance levels, known as S1 and R1 respectively, are calculated by subtracting the previous day’s low and high from the base one. The second level, S2 and R2, is calculated by subtracting the high and low of the day before from the first support and resistance levels. The third level, S3 and R3, is similarly calculated but from the second support and resistance levels.
The main idea behind the Pivot Point indicator is to assist traders in identifying support and resistance levels. These levels are used to help traders identify potential entry and exit points for their trades.
Pivot Points Calculation
To calculate pivot points, you need to know the high, low, and closing prices in the previous trading session. Here is the formula for calculating it:
Pivot Point (PP) = (High + Low + Close) / 3
Once you’ve calculated the basic pivot point, you can then calculate the first level of support and resistance:
Support 1 (S1) = (2 x PP) -High Support 1 (R1) = (2 x PP) – low
The second level of support and resistance can be calculated using the following formulas:
Support 2 (S2) = PP – (High – Low) Suppor 2 (R2) = PP + (High – Low)
Finally, the third level of support and resistance can be calculated using the following formulas:
Support 3 (S3) = Low – 2 x (High – PP) Support 3 (R3) = High + 2 x (PP – Low)
Using Pivot Point Indicator in Trading
Now that you understand how to calculate pivot points, let’s explore how you can incorporate them into your trading strategy.
Firstly, when using this indicator, it’s crucial to note that they have the most impact when used in conjunction with other indicators. This assists in confirming support and resistance zones and reduces the likelihood of false signals.
One way to use the pivot point indicator is to watch for price action near support and resistance levels. If the price approaches a support level, traders might be looking for a buying opportunity. Conversely, if the price approaches a resistance level, traders might be looking for a selling opportunity.
Another approach is to look for price breakouts. If the price surpasses a support or resistance level, it could indicate a reversal or continuation of the trend.
It’s important to remember that pivot points are not foolproof, and relying solely on them for trading decisions is not advisable. Market conditions can change rapidly, and having a comprehensive trading strategy that considers multiple factors, including technical indicators, fundamental analysis, and risk management, is crucial.
In addition to using this indicator in your trading strategy, having a thorough understanding of market trends and price action is vital. This can be obtained through chart analysis, trendlines, and other indicators.
Example of Using Pivot Point Indicator in Forex
Imagine you are a day trader focusing on short-term trades based on daily price movements. You decide to incorporate the pivot point indicator into your trading strategy.
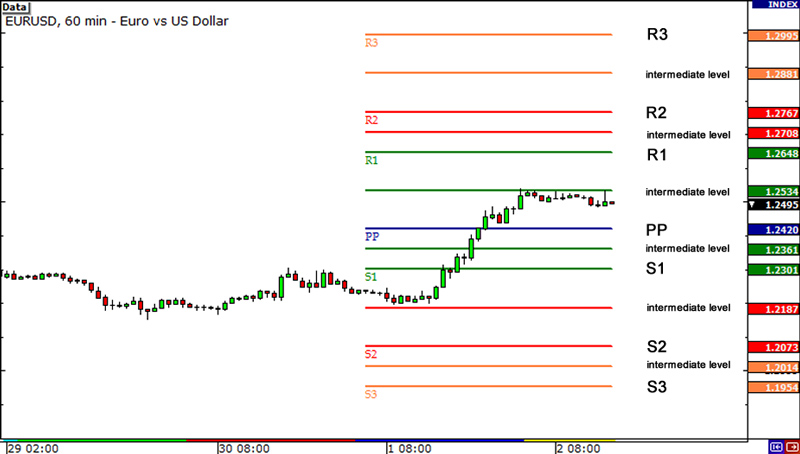
To calculate the pivot-point, you need the high, low, and closing prices from the previous day. Let’s assume, for the EUR/USD currency pair, the highest price yesterday was 1.1000, the lowest was 1.0900, and the closing price was 1.0950.
Using this information, you can calculate the following levels:
Pivot Point (PP) = (High + Low + Close) / 3 = (1.1000 + 1.0900 + 1.0950) / 3 = 1.0950
Resistance 1 (R1) = (2 x PP) – Low = (2 x 1.0950) – 1.0900 = 1.1000
Resistance 2 (R2) = PP + (High – Low) = 1.0950 + (1.1000 – 1.0900) = 1.1050
Resistance 3 (R3) = High + 2 x (PP – Low) = 1.1000 + (2 x (1.0950 – 1.0900)) = 1.1100
Support 1 (S1) = (2 x PP) – High = (2 x 1.0950) – 1.1000 = 1.0900
Support 2 (S2) = PP – (High – Low) = 1.0950 – (1.1000 – 1.0900) = 1.0900
Support 3 (S3) = Low – 2 x (High – PP) = 1.0900 – (2 x (1.1000 – 1.0950)) = 1.0800
These levels can be used to identify potential support and resistance zones for the EUR/USD currency pair.
For example, if the EUR/USD price is currently close to the pivot point (1.0950), you might be looking for buying opportunities if the price approaches Support 1 (1.0900). Conversely, if the price breaks above Resistance 1 (1.1000), you might be looking for selling opportunities if the price approaches Resistance 2 (1.1050).
Differences from Other Indicators
There are several key differences between the pivot point indicator and other indicators used in Forex trading, making its use unique and specific. Here are a few key differences:
- Calculation Based on Price Action: Pivot points are calculated based on the price action of the previous day, while other indicators may use different time frames such as hourly or weekly data. This makes pivot-points particularly useful for daily traders focusing on short-term trades based on daily price movements.
- Simple Calculations: They are based on simple calculations that are easy to understand and use. Other indicators, such as moving averages or the RSI indicator, may be more complex and require a deeper understanding of mathematical formulas and statistical analyses.
- Price-Based Indicator: The pivot point indicator is a price-based indicator and does not rely on additional market data such as volume or open interest. This can make them especially useful in markets where data related to these metrics is limited or unreliable.
- Versatility: Pivot-points are versatile and can be used in various trading strategies. They can be used independently or in conjunction with other indicators to confirm potential support and resistance areas.
The pivot point indicator is widely used by traders in the Forex market, helping them identify potential support and resistance zones. This can be particularly useful for traders looking for entry or exit points in trades where others are also considering entering or exiting positions.
In general, this indicator is a simple yet effective tool that can be used to identify potential support and resistance zones in the Forex market. While it may not be suitable for all trading strategies, it can add valuable insights to a trader’s toolbox and assist in decision-making based on short-term price movements.
Conclusion
The pivot point indicator is a useful technical indicator for Forex traders seeking to identify potential support and resistance zones in the market. Calculated based on the previous day’s high, low, and closing prices, these points can be used to identify potential entry and exit points for trades.
However, pivot points should not be used in isolation and should be combined with other indicators to confirm potential support and resistance areas. Additionally, having a comprehensive trading strategy that considers multiple factors, including technical analysis, fundamental analysis, and risk management, is essential.
While the indicator may not be suitable for all trading strategies, it can be a valuable addition to a trader’s toolkit, providing insights into short-term price movements and aiding in informed decision-making.

