

What you are about to read:
The ability to accurately draw support and resistance levels is one of the most fundamental skills that every price action trader must possess. It is also the foundation for everything that happens afterward. If you draw these levels correctly, trading and executing deals will be smoother, and if you make a mistake, your trading experience is likely to be a discouraging one.
In this article with Brokerland, we want to define what these support and resistance levels are and also explore the reasons for their formation. We will also examine how to correctly identify these levels and then conclude with a few fundamental rules for trading.
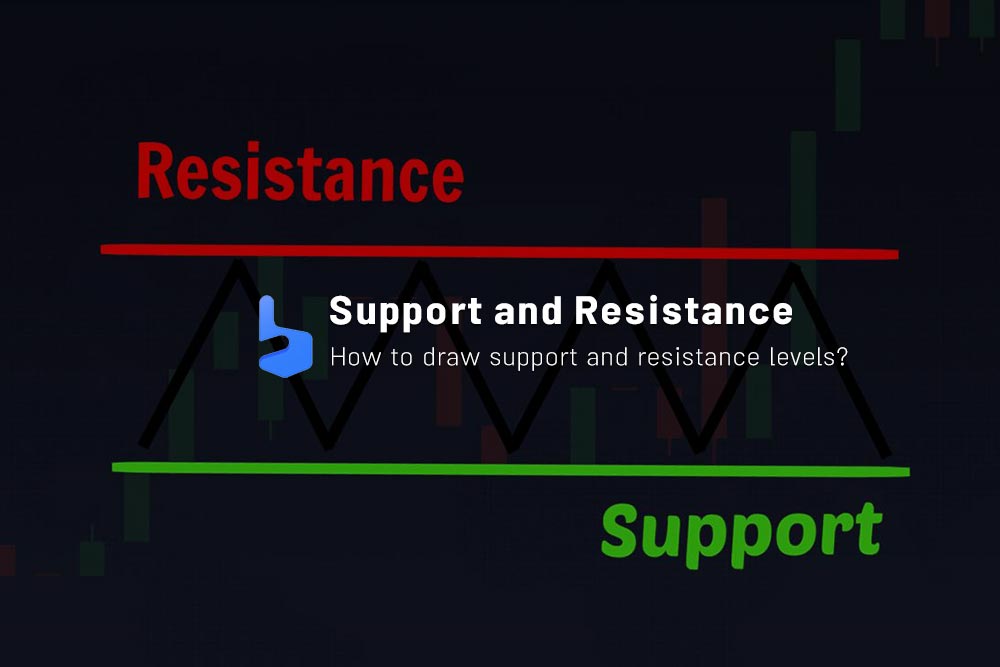
What are Support and Resistance Levels?
Support and resistance levels and lines are simply price levels in the market where traders, depending on market dynamics, value a price either more or less. These levels create a market where, depending on various factors surrounding each currency, it can act as support or resistance.
In fact, these lines are technical analysis tools used in forex trading to identify key price levels where a currency pair may experience a change or a breakout. The resistance level is a price point where the currency pair tends to face selling pressure and prevents it from moving higher. In other words, it is a price level where the supply for the currency pair exceeds demand, leading to a potential price reversal.
On the other hand, the support level is a price point where the currency pair tends to face buying pressure and prevents it from moving lower. This is a price level where the demand for the currency pair is greater than the supply, leading to a potential price reversal.
Traders use support and resistance levels for informed decision-making regarding the timing of entering or exiting trades, as well as for managing their risk by placing stop-loss orders just below the support level or above the resistance line.
Why Do Support and Resistance Levels Form?
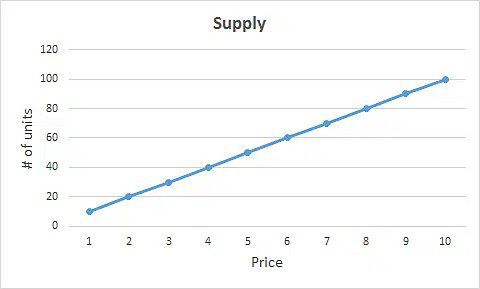
To understand why these levels form, we need to look at the supply and demand curve. Note how, in the supply curve below, the number of units for sale increases as the price rises. To illustrate this in trading terms, as the price goes higher, traders are more inclined to sell their positions.
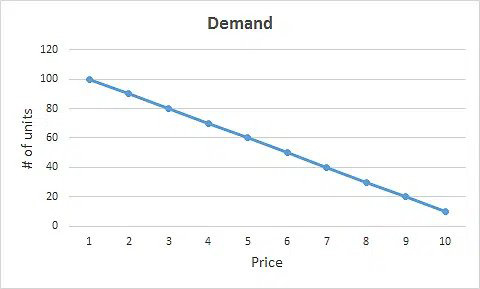
On the other hand, the demand curve is precisely the opposite. As the price increases, the desired number of units decreases. This is because traders are less inclined to buy in a more expensive market.
Therefore, we can consider support and resistance levels as points in the market where traders are more inclined to buy or sell depending on market conditions. This creates a zone of tension between buyers and sellers, often leading to a change in market direction.
How to Draw Support and Resistance Levels
The first thing to note about support and resistance is that they are not always precise. In fact, it’s often better to consider these levels as zones on forex chart.
To draw support and resistance levels in forex, you should use a trading platform such as MetaTrader 4, MetaTrader 5, or TradingView, which provides tools for technical analysis. Here are steps you can follow to draw these lines:
- Select a currency pair and a time frame: Start by choosing a currency pair and the desired time frame for analysis. A common time frame for charting is the daily chart, but you can use other time frames based on your trading strategy.
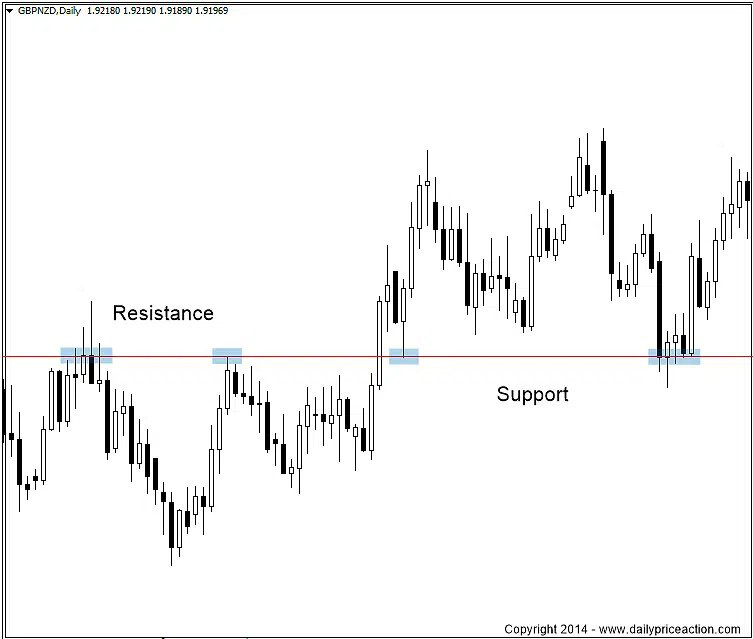
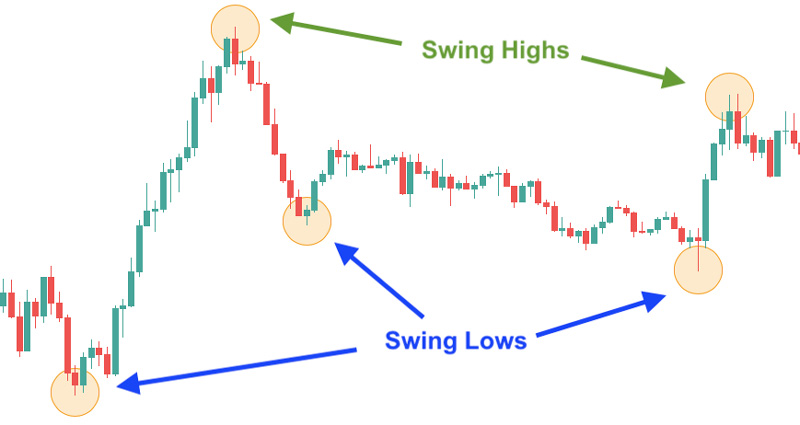
- Identify high and lows: Examine the chart and identify price points where the currency pair has previously reversed or halted. These are known as swing highs and swing lows.
- Draw the lines: To draw a resistance line, connect two or more swing highs with a straight line. To draw a support level, connect two or more swing lows with a straight line. The more times the price has bounced from a level, the more significant it is.
- Adjust the levels: Once you’ve drawn the support and resistance levels, you may need to adjust them slightly to ensure better alignment with high and lows.
It’s important to remember that support and resistance levels are not always precise, and prices may occasionally break through them. Therefore, using other tools and forex indicators to confirm your analysis before making trading decisions is crucial. These levels also indicate areas in the market where traders are more inclined to buy or sell, which can signal a potential change in market direction.
Some Tips for Drawing The Lines
Here are a few simple rules to follow that can significantly improve your ability to identify key support or resistance areas:
Use swing highs and swing lows
By using high and lows as a guide to start drawing support and resistance levels, there’s a higher likelihood of identifying key levels where the most significant buying or selling signals occur.
Don’t worry if the swings and lows don’t match exactly. Remember that most levels won’t perfectly align with swings and lows.
Focus on Key Primary Levels
These are the clearest support and resistance levels and should be immediately visible. If you have to search extensively for a level, it probably isn’t worth placing on your chart. By focusing on key levels, you’ll be in a much better position to make a trade decision when observing signals.
Consider the Last Six Months while drawing Support and Resistance Levels
You don’t need to go back five years to find support and resistance levels. Most levels you need will come from highs and lows that occurred in the last six months. There’s no need to look beyond six months in the past to find excellent levels for trading.
Final Words
Now that we are familiar with the concept of support and resistance levels and how to draw them, it’s important not to overcomplicate this matter. Drawing support and resistance levels should be one of the simpler and stress-free tasks you, as a trader, perform. In fact, if you find yourself expending a lot of energy finding these levels, you’re probably drawing more levels than you really need.
One significant mistake you might make is repeatedly guessing whether you have correctly drawn a level as support or resistance. It’s okay to review your work, but remember that usually, your initial guess and feeling are correct. Here, with Brokerland, we tried to learn forex basic concepts together. Feel free to share your opinions or methods regarding drawing these lines in the comments section below.


