


What you are about to read:
The world of forex is filled with various indicators used by traders alongside fundamental analysis and in different strategies. If you ask any trader in this market about their trading methods and indicator selection, they will likely tell you that to identify effective changes in price patterns, the use of suitable forex indicators is necessary. However, whatever one indicator can do to assist a trader, two compatible indicators can often do better. One example of this is the combination of the MACD and Stochastic indicators.
By combining these two indicators, better results can be achieved in trades. In this article from Brokerland, we will explore the trading strategy, namely the MACD and Stochastic strategy.
Combining the MACD and Stochastic Indicators
MACD and Stochastic are two popular indicators used in forex trading. The MACD indicator (Moving Average Convergence Divergence) is a momentum indicator that helps traders identify potential trend changes in the market. On the other hand, the Stochastic indicator is a momentum oscillator that measures market movements by comparing the closing price of an asset with its price range over a specified period.
The search for two popular indicators that work well together and combining these two for good results has led to the pairing of MACD and Stochastic. This combination works because Stochastic compares the closing price with its price range over a specific time period, while MACD forms two moving averages that diverge and converge. The MACD and Stochastic strategy is highly effective when used correctly. Before delving into this method, it is necessary to separately examine the performance of each of these two indicators.
Introduction to the Stochastic Indicator
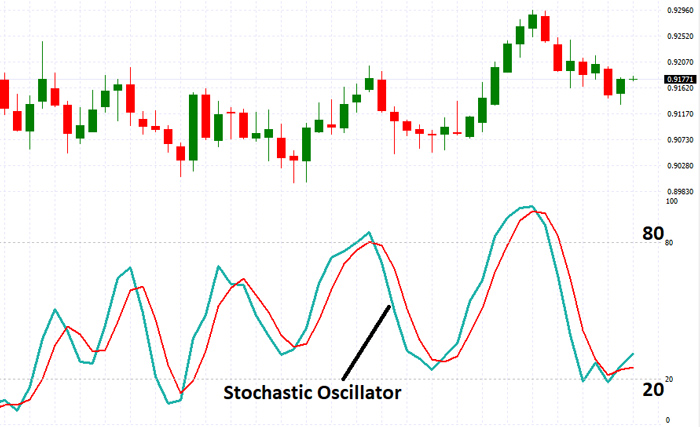
The Stochastic indicator is one of the participants in the MACD and Stochastic strategy, a popular indicator widely used by traders. The basic assumption is that when the price is rising, it tends to close near the recent period’s ceiling, and when it is decreasing, the price tends to close near its recent low. This indicator measures the price relative to its established ranges/levels over a set period, indicating where in its recent trading range it is currently trading.
Stochastic is plotted between values of 0 and 100 and has reference lines at 20 and 80. When comparing these numbers, attention is crucial when Stochastic crosses the reference lines. Crossing above 20 is interpreted as a buy signal, and when it reaches below 80, it is interpreted as a sell signal. Another way to interpret this is to consider readings below 20 as oversold and readings above 80 as overbought.
Below, you can observe a Stochastic indicator shown on the USD/CHF daily chart with reference lines at 20 and 80.
The history of the Stochastic indicator is filled with inconsistencies. Most sources attribute the creation of the Stochastic indicator to George C. Lane, a technical analyst who, after joining Investment Educators in 1954, studied Stochastic. However, Lane made conflicting statements about the invention of Stochastic.
It is possible that Ralph Dystant, the then-head of Investment Educators, or even an unidentified member of the organization, may have invented this indicator. Some analysts believe that Stochastic was likely developed between Lane’s arrival at Investment Educators in 1954 and 1957, a period when Lane claimed the copyright for it.
Introduction to the MACD Indicator
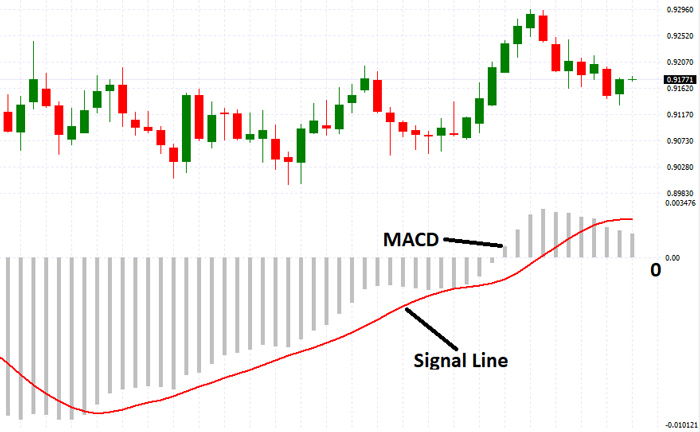
Another indicator for the MACD and Stochastic strategy is MACD, or Moving Average Convergence Divergence. While constructing MACD is straightforward, it is nonetheless very powerful. MACD simply calculates the difference between the short-term exponential moving average and the long-term exponential moving average. The most common combination is a 12-period exponential moving average with a 26-period exponential moving average.
Another line is plotted alongside MACD called the signal or trigger line. The signal line is often a 9-period exponential moving average of MACD itself. Both lines are then drawn on either side of zero. If the short-term moving average is above the long-term moving average, MACD will be above zero, and vice versa.
Below, you can observe a MACD shown on the USD/CHF daily chart with reference lines at 30 and 70.
MACD and Stochastic Crossovers
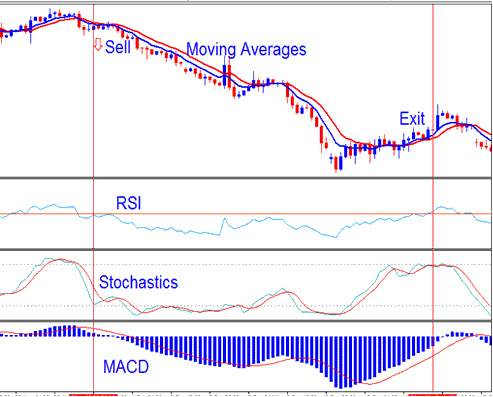
To confirm the trend in a MACD and Stochastic strategy, understanding how to combine an upward crossover of MACD and Stochastic in the simplest scenario is essential. In its simplest form, an upward trend indicates a strong signal for a sustained increase in prices. An upward crossover occurs when a faster-moving average crosses above a slower-moving average, creating market momentum and presenting further price increases.
For the MACD upward crossover, it happens when the histogram value is above the equilibrium line, and when the MACD line has a higher value than the 9-day EMA (Exponential Moving Average), also known as the “MACD signal line.”
The Stochastic upward divergence occurs when the %K value crosses above the %D value, confirming a potential price reversal.
Double Cross
Below is an example of how and when to use a double cross of MACD and Stochastic. Pay attention to the green lines, which indicate the movement of these two MACD and Stochastic indicators together, and the almost complete crossover shown on the right side of the chart.
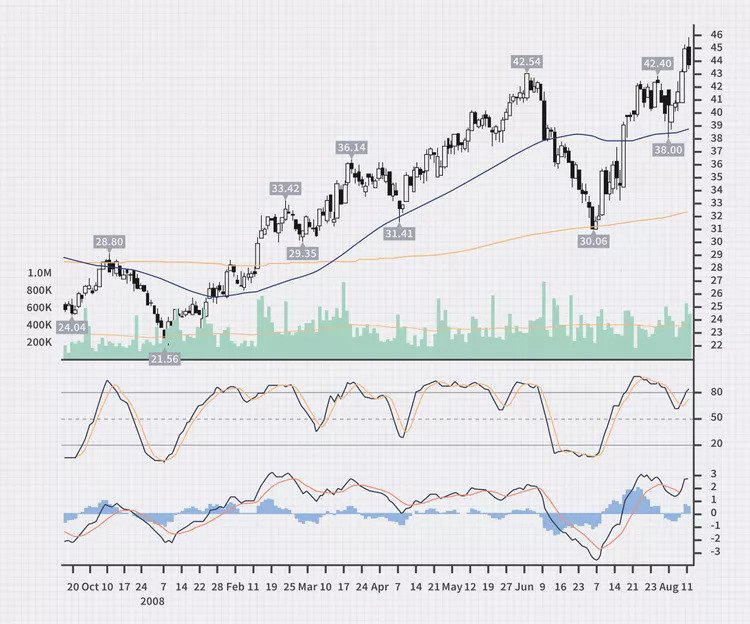
You might observe several instances where MACD and Stochastic are close to crossing simultaneously. For example, in January 2008, mid-March, and mid-April, this happened. It may appear that they have intersected on the chart, but upon closer inspection, you’ll notice that they didn’t actually cross within two days of each other, which is the set criterion. You may want to adjust the criteria to include crossovers that occur in a higher time frame, allowing you to capture movements like those mentioned below.
Experienced traders using the MACD and Stochastic strategy often utilize much shorter timeframes in their indicator settings. Instead of monthly or yearly charts, they prefer five-day charts.
MACD and Stochastic Strategy
When these two indicators, MACD and Stochastic, are used together as the MACD and Stochastic strategy, traders can look for crossover signals from MACD and Stochastic indicators. An upward crossover signal occurs when the MACD line crosses above the signal line, while the Stochastic indicator is below the oversold level (usually 20). A downward crossover signal occurs when the MACD line crosses below the signal line, while the Stochastic indicator is above the overbought level (usually 80).
The MACD and Stochastic strategy can help traders confirm potential trend changes and identify possible entry and exit points. However, it’s crucial to note that no strategy is risk-free, and traders should always conduct their analyses and risk management procedures.
To start, look for upward crossovers within two days of each other. When applying the MACD and Stochastic strategy, ideally, the crossover under the 50 lines on the Stochastic should occur to obtain a longer price move. Also, note that MACD should cross slightly after Stochastic to avoid false signals of price trends or placing you in a sideways range.
Advantages and Considerations of Using the MACD and Stochastic Strategy
Like any other trading strategy we’ve discussed, such as the balanced trading strategy with Ichimoku or the anti-martingale strategy, the MACD and Stochastic strategy has its pros and cons. The advantage of this method is that it allows traders to find a better entry point in an upward trend, making more informed and confident decisions.
As mentioned before, no strategy is perfect. One weakness of the MACD and Stochastic strategy is that, since prices usually require more time to position themselves in the best buying position, fewer actual trades occur. Therefore, you might need a larger portfolio for trading. The MACD and Stochastic crossover allow traders to adjust time intervals and find optimal and consistent entry points. This way, it can be tailored to the needs of both active traders and investors. By experimenting with both MACD and Stochastic indicators, you’ll see how crossovers appear differently in a row. Then, select days that provide the best returns for your trading style and suit your trading strategy. Additionally, you might want to add a Relative Strength Index (RSI), which we thoroughly covered in previous articles, to this combination to have more reliable signals for entering a trade.
Summary
The Forex market is filled with various indicators that can be used together or separately for trading in this market. Two indicators capable of integration and use together in trades are MACD and Stochastic, which we covered in this Forex learning by Brokerland, focusing on teaching this MACD and Stochastic strategy and the crossovers of these two in Forex.
Like any trading strategy, it’s important to know that, with realistic goal-setting, continuous monitoring, and discipline alongside proper risk management, you can use this strategy alongside your other trading methods to increase your profits in this market.


