

What you are about to read:
The Relative Strength Index (RSI) is a popular technical indicator used by forex traders to measure momentum in currency pairs. Traders can use the RSI indicator to identify trend changes, overbought or oversold conditions, and trading opportunities. In this article, Brokerland explores how this indicator works, how to trade with it, its advantages and disadvantages, and some trading strategies that leverage this powerful indicator.
What is the Relative Strength Index?
The RSI indicator was invented by J. Welles Wilder Jr. in 1978. Wilder, a successful mechanical engineer and trader, developed many other popular and best forex indicators such as Average True Range (ATR) and Parabolic SAR.
The RSI is a momentum oscillator that measures the speed and change of price movements. It calculates by comparing the average gains and losses of a currency pair over a specific time period. Its ranges from 0 to 100 and is plotted on a chart alongside the currency pair‘s price.
Wilder initially introduced the Relative Strength Index in his book “New Concepts in Technical Trading Systems,” describing it as a “market-bought and oversold conditions analysis-based trading system.” He designed this indicator to measure performance strength and identify potential trend changes.
Using the RSI Indicator in Trading
The Relative Strength Index is a versatile tool that can be used in various ways. Now that we are familiar with its background and nature, let’s delve into trading with it. Here are some common applications in forex trading:
Identifying Overbought and Oversold Conditions
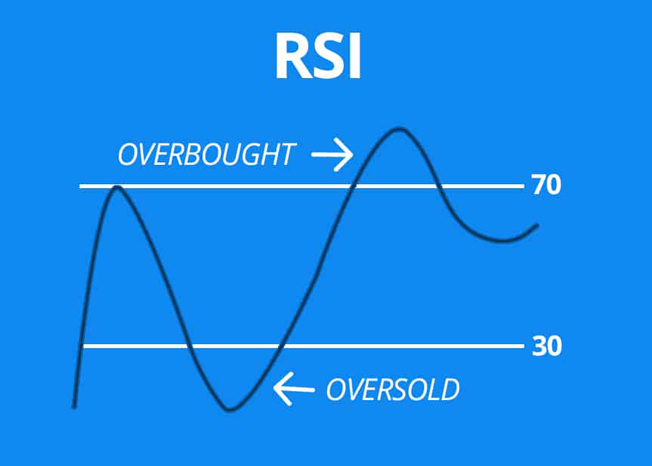
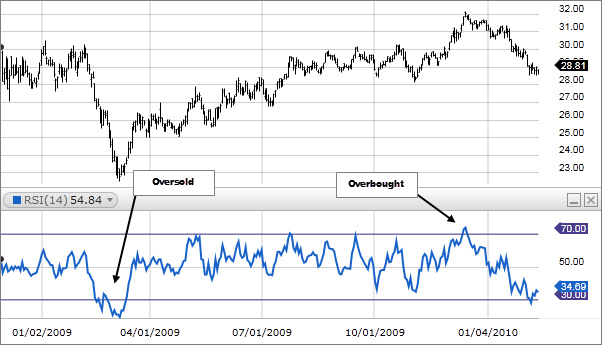
RSI is often used to identify overbought and oversold conditions in a currency pair. When the amount is above 70, it indicates that the currency pair is overbought. Conversely, when this number is below 30, it signals that the currency pair is oversold. Traders can use these levels to identify potential trend reversals.
Trading Breakouts
Another method of trading with the RSI indicator involves using it for breakout trades. When the indicator is within a range and the currency pair’s price breaks out of that range, it can indicate a trading opportunity. Traders can use it to confirm breakouts and enter into trades.
Trend Trading
The Relative Strength Index can also be used to identify the strength of a trend. When the amount is above 50, it signals that the currency pair is in an uptrend, and when it is is below 50, it indicates that the currency pair is in a downtrend. Traders can use these levels to enter trades in the direction of the trend.
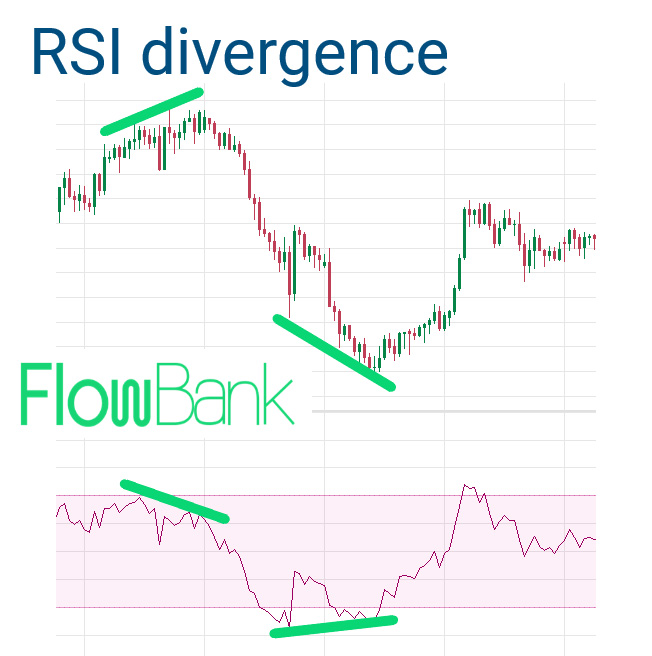
Divergence Trading Analysis
Divergence trading is a strategy that utilizes the RSI indicator to identify potential trend reversals, as discussed in detail in previous articles. When the price of a currency pair is reaching new highs, but divergence does not follow, it’s called bearish divergence. Conversely, when the price of a currency pair is reaching new lows, but the RSI does not follow, it’s called bullish divergence. Traders can use these divergences to identify potential trend reversals.
Tips for using the Relative Strength Index
Here are some tips for trading with the RSI indicator:
Use it in conjunction with other indicators: While the RSI is a powerful indicator, as we’ve mentioned about other indicators in previous articles, it’s best not to use it in isolation. It’s advisable to use it alongside other indicators such as pivot points, MACD and STOCHASTIC or Fibonacci retracement to confirm trading signals.
Utilize different timeframes: When trading with the RSI indicator, it can be applied across various time frames, from minutes to daily charts. Traders should experiment with different timeframes to find the best fit for their trading style.
Apply it in different market conditions: The Relative Strength Index can be used in various market conditions, including trending, ranging, and volatile markets. Traders should utilize it in different market conditions to find the optimal application.
Avoid overtrading: When trading with the Relative Strength Index, it’s essential to note that it can generate numerous trading signals, but not all of them are profitable. Traders should exercise restraint and only execute trades that meet their specific trading criteria.
Pros and Cons
Like any indicator in the forex world, trading with the RSI has its pros and cons. Here are some of the positive and negative aspects of using it in forex trading:
Advantages of RSI Indicator
- Provides early warning signals: The RSI is a leading indicator that can offer early warning signals about a change in trend or market direction.
- Assists in identifying overbought and oversold conditions: It can help traders identify overbought and oversold conditions in the market, which can be useful for timing entry and exit points.
- Ease of Use: RSI is a simple and practical indicator that can be used by traders at all experience levels.
- Confirmation Signals: The RSI indicator can be used in conjunction with other technical indicators to confirm trading signals, helping traders avoid false signals.
- Works in All Market Conditions: This indicator can be utilized in both ranging and trending markets, making it an all-encompassing tool.
Disadvantages of RSI Indicator
- False Signals: Like any indicator, RSI can generate false signals, especially in choppy or ranging markets.
- Subject to Interpretation: Relative Strength Index can be subject to interpretation, leading traders to experiment with different settings or parameters.
- Lagging Indicator: Despite being a leading indicator, RSI is still a lagging indicator, meaning it can only provide signals after a trend has started.
- Overuse: As a popular indicator, RSI usage by many traders can result in overcrowding and incorrect signals.
- One-Dimensional: RSI only measures price movement in one dimension, potentially not providing a complete picture of market conditions.
Summary
The RSI indicator is a popular technical tool used by forex traders to measure currency pair momentum. It can be employed to identify potential trend changes, overbought or oversold conditions, and potential trading opportunities.
Traders can utilize it in various ways, including identifying divergences, breakout trades, and trend analysis. It’s crucial to use this indicator in conjunction with other indicators, employ multi-timeframe analysis, and refrain from overtrading or trading around kill zones. With these considerations, traders can enhance their trading performance and achieve greater success in the forex market.


