


What you are about to read:
In the world of Forex, there exists a multitude of tools and ways, from Prop trading to Forex Experts and AI Bots, that traders can utilize for trading. Trading in the Forex market requires sufficient knowledge and understanding of these numerous elements because each of these methods and tools can be effective in specific situations and positions, contributing to traders’ profits. One highly useful and crucial tool in Forex is the Fibonacci indicator, which, as the name suggests, operates using the Fibonacci sequence. In the following, we thoroughly examine and explain the functionality of this indicator with Brokerland.
Introduction to the Fibonacci Sequence
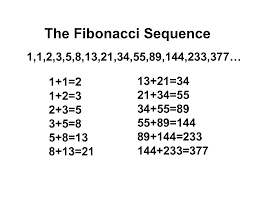
The Fibonacci sequence is a series of numbers that has fascinated mathematicians for centuries. This sequence is created by adding the two preceding numbers to obtain the next number in the sequence. For instance, the initial numbers in this series are:
0, 1, 1, 2, 3, 5, 8, 13, 21, 34, 55, 89, …
The Fibonacci sequence possesses a unique feature: as the sequence progresses, the ratio between each number and the one preceding it approaches a constant value, approximately 1.61803398875, known as the “golden ratio.” This ratio is observed in various natural phenomena, such as plant growth patterns and human body proportions, and is aesthetically pleasing to the eye.
Traders and investors have paid attention to this sequence and found a way to apply it in financial markets. The Fibonacci indicator, based on this sequence and the golden ratio, serves as a tool to help traders identify support and resistance levels in the market, enabling them to benefit from it in their trades. In the following sections, we provide further details on how this indicator operates.
How Does the Fibonacci Indicator Work?
This indicator is used to identify support and resistance levels in a market and utilizes horizontal lines to represent areas where the price of an asset may encounter support or resistance. These levels are determined by applying the Fibonacci sequence and the golden ratio to the price action of the asset.
To use this indicator, a trader must first identify a significant price movement in an asset, whether upward or downward. Once the movement is identified, they can apply the Fibonacci sequence to that move.
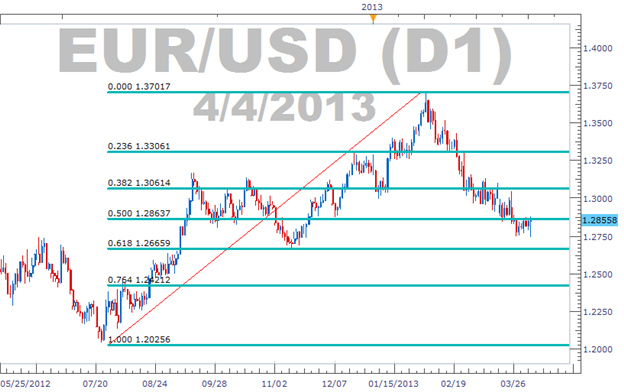
This sequence is applied by drawing horizontal lines at specific levels that correspond to Fibonacci ratios. The most common ratios are 0.382, 0.500, and 0.618. These levels are known as “Fibonacci retracement levels.”
Retracement levels are used to identify support and resistance levels in a market. If the price of an asset retraces to one of these levels, it may encounter support or resistance. Traders can use these levels for entering or exiting trades or setting stop-loss orders.
The Fibonacci indicator can also be used in conjunction with other technical indicators to confirm these levels. For example, a trader might use this indicator alongside a moving average to confirm a support level.
Using the Fibonacci Indicator in Trading
Let’s look at an example of how this indicator can be used in practice. In the chart below, you can see the price of the S&P 500 index over a few months.
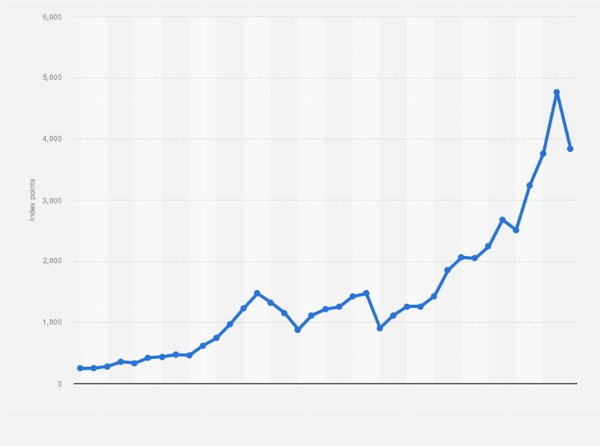 In this chart, we observe that the S&P 500 index has been on an upward trend for several months. Additionally, there is a significant upward move from late September to early November.
To apply the indicator, we draw a horizontal line at the lowest point in late September and another line at the highest point in early November. Then, Fibonacci retracement levels are applied for the upward move.
We can see that in early December, the price of this index retraced to the 0.618 Fibonacci retracement level. This level acted as support, and the price of the index resumed its upward trend.
Traders could have used this level to enter a long position or set a stop-loss order. The Fibonacci indicator provides a clear level of support that can be utilized.
It’s crucial to note that, like most strategies and other indicators, including the Ichimoku indicator discussed in previous articles, this indicator should not be used in isolation. Traders should use it in conjunction with other forex indicators and fundamental analysis for informed decision-making about trades.
Types of Fibonacci Indicator
Now that we understand the Fibonacci sequence and its indicator, it’s essential to know the types available in the forex world. Various types of this indicator can help traders identify potential support and resistance levels in the market. Here are three of the most common types, which will be detailed in future articles due to their significance:
- Fibonacci Retracement: This basic form of the Fibonacci indicator involves drawing horizontal lines at Fibonacci retracement levels for a significant price movement. These levels act as support and resistance.
- Fibonacci Arcs: This type includes drawing arcs between the ceiling and floor prices of an asset. The arcs are based on the Fibonacci sequence and the golden ratio, indicating support and resistance levels.
- Fibonacci Fans: This form involves drawing diagonal lines between the ceiling and floor prices of an asset. Like the others, these lines are based on the Fibonacci sequence and the golden ratio, revealing potential support and resistance levels.
Each type of these indicators has its strengths and weaknesses, and traders should choose one that best aligns with their trading style and goals. Some traders might prefer to use multiple Fibonacci-indicators in conjunction with other indicators and fundamental analysis for well-informed decision-making in their trades, which would be a prudent approach.
Limitations of the Fibonacci Indicator
Like all technical indicators, the Fibonacci indicator has its limitations. One constraint is that it is a lagging indicator, meaning it operates based on past price performance. Traders should use other indicators to confirm support and resistance levels.
Another limitation is that this indicator is not always reliable. It’s crucial to remember that the market is unpredictable, and prices can sometimes deviate from Fibonacci levels. Traders should always employ risk management strategies, such as stop-loss orders, to limit their losses in case the market moves against them.
Conclusion
The Fibonacci indicator is a useful tool for traders and investors seeking to identify support and resistance levels in the market. This indicator operates based on the Fibonacci sequence and the golden ratio, using horizontal lines to indicate areas where an asset’s price may encounter support or resistance.
Traders should use this indicator alongside other technical indicators, sentiment analysis, and fundamental analysis for informed decision-making in trades. While this indicator has limitations and should not be used in isolation, traders, like with any other trading strategy, should always employ risk management strategies, such as stop-loss orders, to limit potential losses in case the market moves against them.
In general, the Fibonacci indicator is a valuable tool that can assist traders and investors in identifying potential trading opportunities in financial markets. Traders, with a proper understanding of how the indicator works and how to use it in practice, can increase their chances of success in the markets.
