

What you are about to read:
Renko charts are a popular charting technique used by traders in financial markets, especially in Forex and crypto trading. These charts have a unique appearance and provide traders with a different method for analyzing price movements in the markets. In this article, Brokerland will delve into what Renko charts are and how they are used in Forex and crypto trading.
What is Renko Chart?
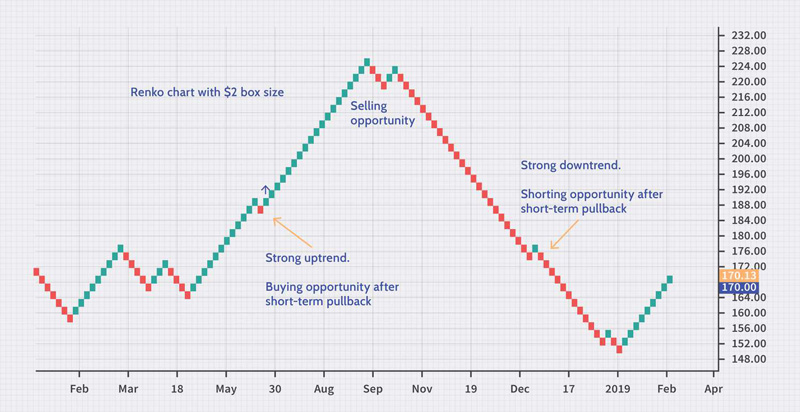
Renko charts are a type of charting technique used in technical analysis. They involve plotting price movements using blocks or bricks (the name of this chart is derived from the Japanese word for bricks). Instead of using candles or bars, each brick represents a fixed price movement, and the chart only plots new bricks when the price moves beyond a specific price threshold. This threshold is called the brick size, and traders can customize it according to their trading style and preferences.
Unlike other types of charts in Forex, such as candlestick or bar charts, Renko charts do not consider time or volume. Instead, they solely focus on price movements, allowing traders to easily identify trends and reversals in the market. These charts are often used in conjunction with other technical forex indicators, such as moving averages or the RSI indicator, to confirm forex signals and make more informed decisions.
How to Read Renko Charts
Reading Renko charts is relatively simple. Each brick represents a fixed price movement, and the chart only plots new bricks when the price moves beyond a specific price threshold. The size of the brick can be customized by the trader but is usually set based on a certain percentage of the Average True Range (ATR).
When the price moves in the direction of the trend by the size of the brick, a new brick in the same direction is added to the chart. Conversely, when the price moves against the trend by the size of the brick, a new brick in the opposite direction is added to the chart. The resulting chart is a visual representation of price movements in the market, consisting of a series of bricks or blocks.
Trading Strategies for Renko Charts
Renko charts are utilized by traders to identify trends and reversals in the market. Several trading strategies can be employed with these charts, but the most common ones involve trend following and mean reversion.
Trend Following Strategies
Trend following strategies involve identifying the trend direction and trading in that direction. Renko charts are particularly useful for trend-following strategies as they filter out noise and highlight the underlying trend. Traders can use moving averages or other trend indicators to confirm the trend and make decisions based on it.
Mean Reversion Strategies
Mean reversion strategies entail identifying overbought or oversold conditions and trading in the opposite direction of the trend. These charts can also be utilized for mean reversion strategies by identifying key support and resistance levels and trading when the price reaches these levels. Traders can use oscillators or other momentum indicators to confirm overbought or oversold conditions and make trading decisions accordingly.
Advantages
Using Renko charts in Forex and crypto trading has several advantages:
- Easy Identification of Trends: Renko charts make it easy to identify trend in the market by filtering out noise and emphasizing the fundamental trend.
- Adjustable Brick Size: Traders can customize the size of bricks or blocks according to their trading style and preferences.
- Reduced Trading Noise: They filter out market noise, making trading decisions more informed and straightforward for traders.
- Clear Trading Signals: These charts provide clear trading signals that are easily understandable and actionable.
- Compatibility with Other Indicators: These charts can be used in conjunction with other technical indicators such as moving averages or oscillators for confirming trading signals and making more informed trading decisions.
Disadvantages
While using Renko charts in Forex and crypto trading has several advantages, there are potential drawbacks to consider:
- Lack of Time and Volume Information: Renko charts do not consider time or volume, which can be essential factors in trading decisions.
- Potential for False Signals: They may produce false signals, especially when the brick or block size is too small.
- Not Suitable for All Traders: They may not be suitable for all traders, especially those who prefer traditional candlestick or bar charts.
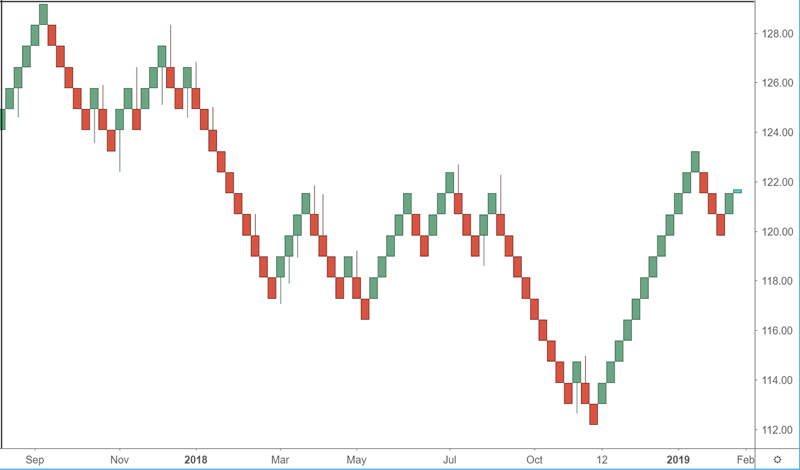
Candlestick vs Renko Charts: Which Is Better?
Whether Renko charts are better than candlestick charts depends on the trader’s style and preferences. Both types of charts have their own pros and cons, and each may be more suitable for specific trading strategies or market conditions.
Candlestick charts are the most widely used type of chart in Forex and crypto trading. They provide precise information about price movements, including opening, closing, high, and low prices for each trading period. This enables traders to identify market patterns and trends, making informed trading decisions based on this information.
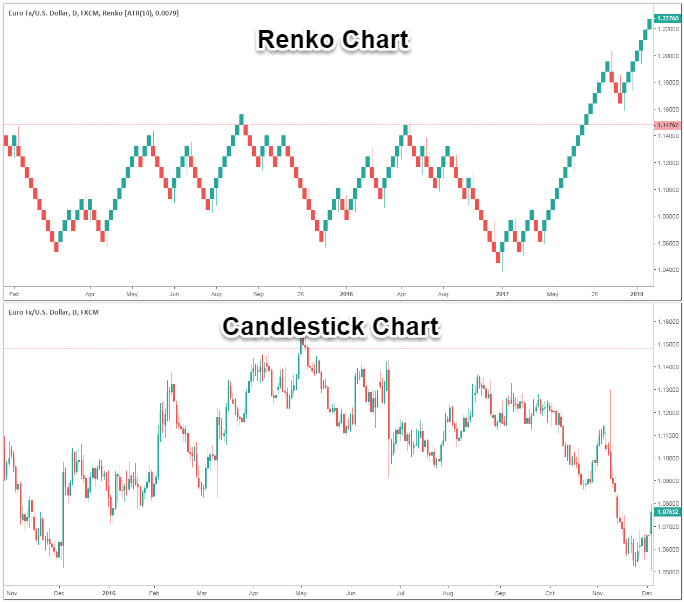
On the other hand, Renko charts are unique in that they filter out market noise and solely focus on price movements. This allows traders to easily identify trends and reversals in the market without being distracted by short-term fluctuations or market noise. Additionally, they are adjustable, allowing traders to customize the size of bricks or blocks according to their trading style and preferences.
Ultimately, whether Renko charts are better than candlestick charts depends on the trader’s personal preferences and trading strategy. Some traders may prefer the precise information provided by candlestick charts, while others may appreciate the simplicity and clarity of theme. It’s crucial for traders to experiment with different chart types and find what works best for their trading style and preferences.
Conclusion
Renko charts are a unique charting technique widely used by traders in financial markets, especially in Forex and crypto trading. In this Brokerland forex learning article, we provided a comprehensive explanation of theme. These charts offer a different approach to analyzing price movements in the market and can be used for both trend-following and mean-reversion strategies.
While there are several advantages to using Renko charts, it’s essential to consider potential drawbacks. Traders should carefully assess their trading style and preferences before deciding to incorporate these charts into their trading strategy. Overall, they can be a valuable tool for traders looking for a different method of analyzing price movements in the market.


