

What you are about to read:
In the trading world, every forex indicator helps traders gain insight into market trends and make informed decisions. Among them, the volume indicator stands out as a vital tool for measuring market activity and potential price changes.
In this article from Brokerland, we will explore the concept of this indicator in forex trading, its importance, calculation methods, and practical applications to enhance trading strategies, and introduce the best volume indicators in forex.
Best Volume Indicator in Forex
Technical analysis is a common approach to predicting future price changes by analyzing past market data. Forex traders use various indicators such as pivot point indicators, Fibonacci indicators, and many others to gain insights into market sentiments, movements, and turning points. These indicators involve mathematical calculations based on price data, volume, or other factors.
The volume indicator in forex is a crucial tool in technical analysis that measures the total number of transactions executed in a specific time period. In the forex market, where there is no centralized exchange (for better understanding, you can read the article on decentralized crypto exchanges), measuring the total traded volume is not possible. Instead, forex traders rely on tick volume, which indicates the number of price changes in a specific time frame.
Importance of Volume in Forex Trading
As the name suggests, the best volume indicators measure trading volume. But what is the importance of volume? Volume is a fundamental element in understanding market dynamics, providing valuable insights into the strength of price movements and trader participation. High trading volume usually occurs during significant market events such as economic releases or geopolitical developments, serving as one of the signals for trading with the most important forex news. An increase in volume can indicate the potential emergence of a new trend or the continuation of an existing trend.
Calculation of the Volume Indicator
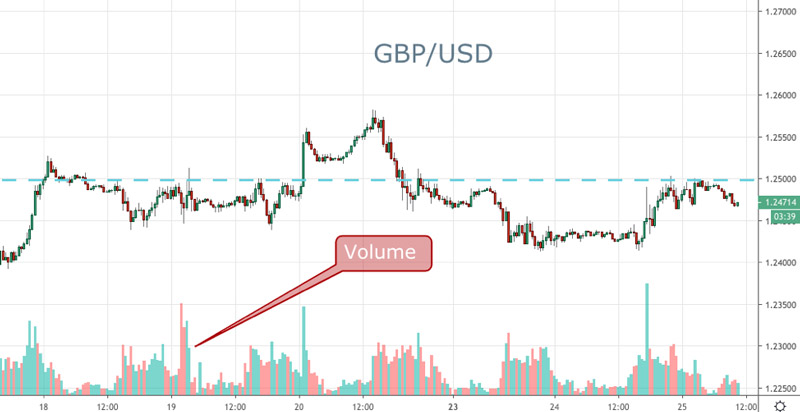
The forex volume indicator is usually plotted as a histogram or a line chart below the price chart. The calculations vary depending on the trading platform or charting software used, such as MetaTrader 4 or 5. Some platforms may display tick volume, while others provide volume based on the number of traded contracts or the total hypothetical value of the volume.
Continuing with the discussion of the best volume indicators in forex and their calculations, let’s review the concept of ticks before delving into these volume indicators.
- Tick Volume: Tick volume indicates the number of price changes (ticks) occurring in a specified time frame.
- Formula: Tick Volume = Number of Price Changes (Ticks)
Types of The Volume Indicators in Forex
There are several volume indicators in forex, each providing unique insights into market activity. Some common types include:
On-Balance Volume (OBV): Developed by Joseph Granville, OBV measures positive and negative volume flow to predict price trends. It is an accumulation/distribution indicator that adds volume on up days and subtracts it on down days.
Formula:
- OBV = Previous OBV + Current Volume, if the closing price is higher than the previous closing price.
- OBV = Previous OBV – Current Volume, if the closing price is lower than the previous closing price.
- OBV = Previous OBV, if the closing price is equal to the previous closing price.
Volume Weighted Average Price (VWAP): VWAP volume indicator calculates the average price traded for a currency pair during the day, weighted by volume.
Formula:
VWAP = Σ (Price × Volume) / Σ Volume, for each trade in the specified period.
Accumulation/Distribution Line (A/D): A/D evaluates buying and selling pressure based on the relationship between closing price and the trading range.
Formula:
A/D = Previous A/D + [(Closing Price – Low) – (High – Closing Price)] × Volume
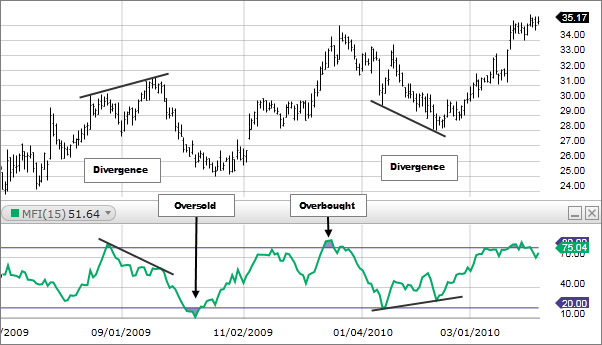
Money Flow Index (MFI): MFI combines price and volume data to measure the strength of money flow in a currency pair. It oscillates between 0 and 100 and can help identify overbought and oversold conditions.
Formulas:
- Typical Price = (High + Low + Closing Price) / 3
- Money Flow = Typical Price × Volume
- MFI = 100 – (100 / (1 + Money Flow Ratio))
- Money Flow Ratio = (Sum of Positive Money Flow) / (Sum of Negative Money Flow)
Understanding these volume indicators enhances a trader’s ability to analyze market trends and make well-informed decisions. Each indicator serves a specific purpose, providing valuable insights into market dynamics.
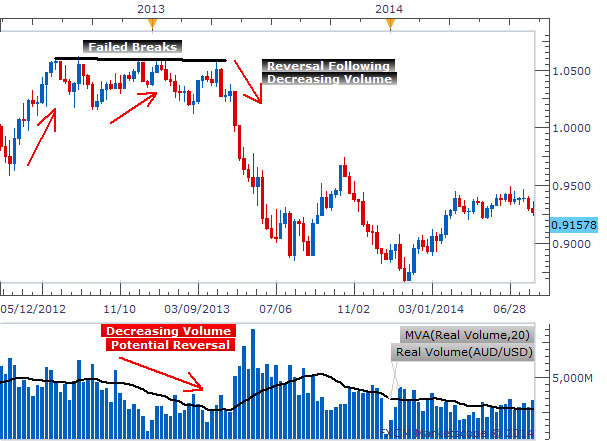
Understanding volume indicators requires a careful analysis of the relationship between price movements and corresponding volume changes. When the price trend aligns with an increase in volume, it is interpreted as confirmation of the trend. Conversely, divergence between price and volume may indicate a potential reversal or a weak trend.
Which is the Best Volume Indicator in Forex?
In forex trading, there isn’t a single best volume indicator that suits every trader’s needs. The effectiveness of volume indicators depends on various factors, including trading style, strategy, and trader preferences. Different types offer unique insights into market activity. Some traders may find one more useful than others based on their specific trading goals.
The best volume indicator in forex for you depends on your trading strategy and the insights you seek to gain from volume analysis. Some traders may prefer using multiple volume indicators to confirm signals and obtain a more comprehensive view of market dynamics. Experimenting with different indicators, understanding how they function, and integrating them into your trading system before determining which aligns with your trading goals is crucial.
Additionally, keep in mind that volume data in the forex market may not be as reliable as in other markets due to its decentralized nature. Forex brokers often provide tick volume data instead of actual volume, which may limit the accuracy of volume analysis. In such cases, combining volume analysis with other technical indicators like moving averages and price action analysis can lead to stronger trading decisions.
Trading Strategies Based on Volume
Incorporating volume indicators into trading strategies can enhance decision-making processes and improve trading results. Some popular volume-based trading strategies include:
- Volume Confirmation: Using volume to confirm the validity of price movements and trends.
- Volume Breakout or Breakdown: Identifying significant increases in volume as potential breakout opportunities.
- Volume Divergence: Observing the disparity between price and volume to predict trend changes.
- Volume Climax: Detecting a sudden surge in volume that may indicate the end of a trend.
Using the best volume indicators in trading strategies
Using volume indicators in forex trading strategies can provide valuable insights into market activity and potential price movements. Here are several ways to incorporate them into your trading strategies:
Volume Confirmation in Trend Trading
- Look for an increase in volume during an upward price trend, confirming the strength of the trend.
- During a downtrend, seek an increase in volume during downward price movements, indicating strong selling pressure.
- When price and volume trends align, consider entering trades, enhancing the likelihood of a successful trade.
Volume Breakout Trading
- Monitor significant increases in volume accompanying price breakouts from support or resistance levels.
- A breakout with high volume suggests strong market conviction, potentially leading to a sustained price movement.
- Wait for the price to move beyond a range and confirm the breakout with substantial volume before entering a trade.
Volume Divergence for Reversal Trades
- Volume divergence occurs when the price moves in one direction, but volume moves in the opposite direction.
- Look for situations where price reaches higher highs or lower lows while volume does not follow suit, signaling potential weakening of the trend and a possible reversal in price direction.
Volume Climax for Exhaustion Points
- Monitor a significant surge in volume, which may indicate market exhaustion and the end of a trend.
- Volume climaxes often occur near the market’s high or low points, indicating a potential reversal in the trend.
- Combine volume indicators with other indicators or candlestick patterns such as rectangle chart patterns or head and shoulders patterns to confirm potential reversal points.
Using Volume for Support and Resistance Levels
- Utilize volume indicators to identify significant price levels with high trading activity.
- These levels often act as support or resistance, indicating where most traders are active. trades around these levels, particularly around order blocks.
Volume Divergence with Oscillators
- Combine forex volume indicators with oscillators like Money Flow Index (MFI) or Relative Strength Index (RSI).
- Look for instances where the oscillator indicates oversold or overbought conditions while volume diverges from the price trend.
- This could be a sign of a potential reversal or exhaustion points in the trend.
Setting Stop Loss and Take Profit Levels Based on Volume
- Adjust forex order, stop-loss levels, based on volume changes. For instance, if a trade is in a downtrend, set the stop loss just above a significant increase in volume to protect against potential price reversals.
- Use volume analysis to determine take-profit levels in areas with low liquidity or price exhaustion points.
Incorporating the best volume indicators into your forex trading strategies can enhance decision-making and increase the probability of successful trades. Keep in mind that volume data in the forex market may have limitations due to its decentralized nature. Forex brokers often provide tick volume data instead of actual volume, requiring traders to adapt their analysis accordingly. Combining volume analysis with other technical indicators and price action analysis can lead to more robust trading decisions.
Summary of Volume Indicator in Forex
Forex traders employ various methods to profit in this market, ranging from using forex expert advisors to forex trading with AI. In this journey, technical indicators provide significant assistance to traders, with one of the most useful being the volume indicator. This indicator can enhance decision-making in your trading strategies and provide valuable insights into market activity.
The volume indicator in forex is a powerful tool for forex traders to assess market activity, determine trend strength, and make informed decisions in trades. Understanding volume dynamics allows traders to identify potential opportunities and risks, leading to more successful trading strategies.
There are various types of volume indicators in forex, and it’s not possible to definitively introduce one as the best volume indicator. This is because it depends on the trading approach and preferences of each trader.
Like any other technical indicator, using the volume indicator alongside other tools and analysis techniques is essential to gain a comprehensive understanding of the market. Traders, by incorporating volume analysis into their trading approach, can increase their chances of success in the dynamic and ever-changing forex market.

