

What you are about to read:
Harmonic patterns are a popular trading technique used in the Forex market to identify reversal points. These patterns are based on the assumption that market trends repeat predictably, allowing traders to use this knowledge for more precise entry or exit points. In this article from Brokerland, we will discuss what these patterns are, their various types, and how to effectively trade them.
What Are Harmonic Patterns?
In the world of Forex, there are various patterns, and in previous articles, we introduced some of them, such as the flag chart patterns or the triangle patterns trading strategy. Harmonic patterns are a type of technical analysis tool that utilizes geometric patterns to identify pivotal or reversal points in the market. These patterns are based on Fibonacci ratios and are used to identify support and resistance lines in the market. They are called harmonic patterns because they are based on harmonic movements in market trends.
There are different types of harmonic patterns, including the Gartley pattern, the Bat pattern, the Crab pattern, the Butterfly pattern, and the Cypher pattern. Each of these patterns is based on different Fibonacci ratios and has its own unique characteristics.
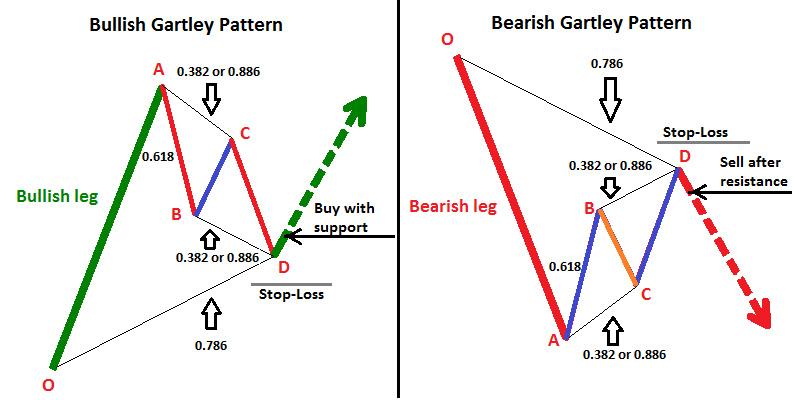
The Gartley Pattern
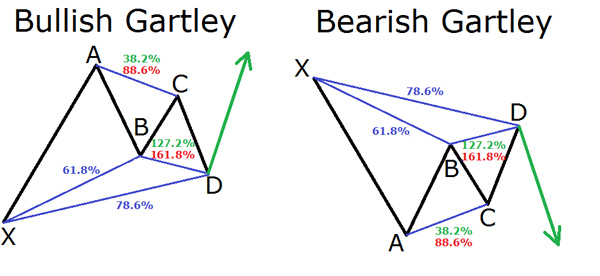
The Gartley pattern is one of the most widely used harmonic patterns in the Forex market, representing a reversal pattern, either bullish or bearish, formed by a series of price oscillations. The pattern is named after H.M. Gartley, who first introduced it in his book titled “Profits in the Stock Market.”
The Gartley pattern is composed of four price points identified as X, A, B, and C. This pattern begins with a significant price movement, labeled as X, which is followed by a reversal to point A. From point A, the price moves in the direction of the initial price movement to point B. Then, the price retraces back to point C, usually around 61.8% of the move from point A to point B. Finally, the price moves in the direction of the initial trend, reaching point D, which is approximately 78.6% of the move from point X to point A.
The Bat Pattern
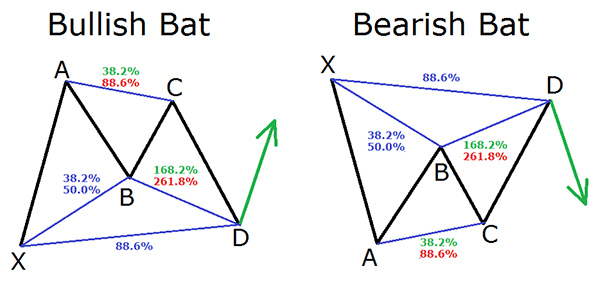
The Bat pattern is a variation of the Gartley pattern, named after the shape it forms. This pattern is also a reversal pattern, either bullish or bearish, formed by a series of price oscillations. The pattern consists of five price points labeled as X, A, B, C, and D.
This pattern begins with a significant price movement, labeled as X, which is followed by a reversal to point A. From point A, the price moves in the direction of the initial price movement to point B. Then, the price retraces back to point C, usually around 38.2% of the move from point A to point B. Finally, the price moves in the direction of the initial trend, reaching point D, which is approximately 88.6% of the move from point X to point A.
The Crab Pattern
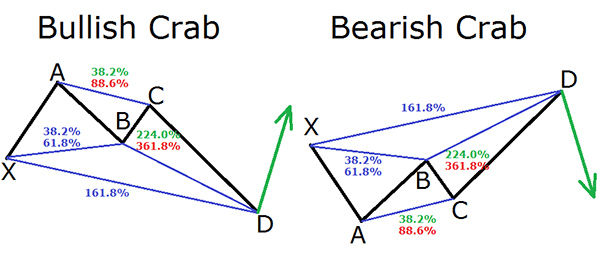
The Crab pattern is another type of harmonic pattern, essentially a variation of the Gartley pattern, and it’s named after its shape. It is a reversal pattern, either bullish or bearish, formed by a series of price oscillations. The pattern consists of five price points labeled as X, A, B, C, and D.
This pattern begins with a significant price movement, labeled as X, which is followed by a reversal to point A. From point A, the price moves in the direction of the initial price movement to point B. Then, the price retraces back to point C, usually around 38.2% of the move from point A to point B. Finally, the price moves in the direction of the initial trend, reaching point D, which is approximately 161.8% of the move from point X to point A.
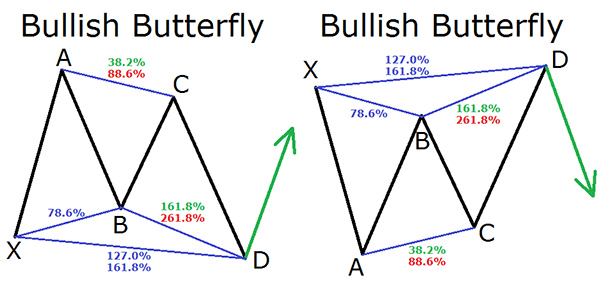
The Butterfly Pattern
The Butterfly pattern is another type of harmonic pattern and is, again, a variation of the Gartley pattern. This pattern is also a reversal pattern, either bullish or bearish, formed by a series of price oscillations. The pattern consists of five price points labeled as X, A, B, C, and D.
Similar to other harmonic patterns, this pattern is named after its visual resemblance to a butterfly. The pattern begins with a significant price movement, labeled as X, followed by a reversal to point A. From point A, the price moves in the direction of the initial price movement to point B. Then, the price retraces back to point C, usually around 78.6% of the move from point A to point B. Finally, the price moves in the direction of the initial trend, reaching point D, which is approximately 127.2% of the move from point X to point A.
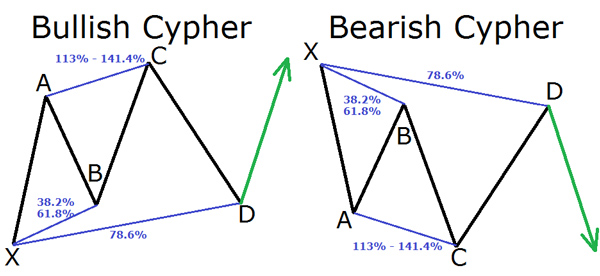
The Cypher Pattern
The Cypher pattern is the latest example in the harmonic patterns tutorial, and like other types, it’s a variation of the Gartley pattern named for its pattern shape. It is also a reversal pattern, either bullish or bearish, formed by a series of price oscillations. The pattern consists of five price points labeled as X, A, B, C, and D.
This pattern begins with a significant price movement, labeled as X, followed by a reversal to point A. From point A, the price moves in the direction of the initial price movement to point B. Then, the price retraces back to point C, usually around 38.2% of the move from point A to point B. Finally, the price moves in the direction of the initial trend, reaching point D, which is approximately 78.6% of the move from point X to point A.
Trading The Harmonic Patterns
After learning about harmonic patterns and getting familiar with their various types, it’s essential to understand how to use them for trading in the forex market. Harmonic patterns can be traded using different strategies. A common strategy is to wait for the pattern to complete and then enter a trade in the reversal direction. For example, if the pattern is bullish, a trader might enter a long position when the price reaches point D.
Another strategy involves using the pattern to identify support and resistance levels. For instance, if the pattern is bearish, a trader might enter a short position at point D and then use the pattern to identify targets for profit.
It’s crucial to note that harmonic patterns should be used in conjunction with other technical analysis tools to confirm their validity. Traders should also be aware of potential risks in harmonic pattern trading, such as false signals and market fluctuations. Traders can incorporate sentiment analysis alongside forex indicators and their strategies to leverage harmonic patterns and enhance their chances of success.
Advantages and Disadvantages of Harmonic Patterns in Forex
Like all other patterns in the world of forex learning, this pattern also comes with its own set of pros and cons. Let’s delve into them.
Advantages of Harmonic Patterns
- Clear and Explicit Trading Signals: Harmonic patterns provide clear and explicit trading signals, aiding traders in identifying market reversals. This makes entry and exit for traders more straightforward.
- High Probability of Successful Trades: Harmonic patterns exhibit a high probability of success, especially when used in conjunction with other technical analysis tools. This means traders can execute profitable trades in many instances.
- Risk Management: These patterns empower traders to precisely determine stop-loss levels, contributing to risk management and minimizing losses while preserving capital and prevent margin calls.
- Easy Identification: Harmonic patterns are easily identifiable, making them accessible for traders at all experience levels. Even novice traders can use them for executing profitable trades.
- Scalability: These patterns can be applied across various time frames, allowing traders to use them for both short-term and long-term trades. This versatility transforms them into a versatile tool for traders.
Disadvantages of Harmonic Patterns in Forex
- Incorrect Signals: Like all technical analysis tools, harmonic patterns are not foolproof. There is always a risk of false signals that can lead to losses for traders.
- Need for Patience: This trading method requires patience for effective trading. Traders must wait for the pattern to fully form before entering a trade, which might take time. This could be discouraging for traders seeking quick profits.
- Complexity: Understanding harmonic patterns, especially for novice traders, can be complex. Proficiency in identifying and trading them requires time and practice.
- Limited to Specific Market Conditions: These patterns perform best in trending markets and may not be as effective in ranging and volatile markets. This limitation can restrict their usefulness in specific market conditions.
- Dependency on Additional Analysis: Harmonic patterns need to be used in conjunction with other technical analysis tools for confirmation. This means traders must be skilled in multiple technical analysis techniques for effective utilization of harmonic patterns.
Conclusion
Harmonic patterns are powerful tools for identifying reversal points in the forex market. With an understanding of various patterns and how to trade them effectively, traders can increase their chances of success and maximize their profits. However, it’s crucial to remember that harmonic patterns should be used in conjunction with other tools and technical indicators.
While harmonic patterns offer numerous advantages in the forex market, they come with their share of disadvantages. Traders need to be aware of potential risks associated with this trading method and take measures to mitigate these risks. Nevertheless, with proper knowledge and experience, this strategy can be a valuable tool for traders seeking profitable trades in the forex market.


