

What you are about to read:
Price action trading is a common technique used by traders in financial markets. It is a technical analysis method that involves analyzing price movements to determine market direction and make trading decisions. This strategy is a simple yet effective approach to trading in financial markets and is becoming increasingly popular due to its efficiency. In this article of Brokerland Forex learning, we provide a guide to price action and its fundamentals for traders.
What is Price Action?
Price action trading is a method used by traders to analyze the price movements of financial instruments such as stocks, forex, and commodities. The goal is to identify patterns and forex trend occurring in the market and use that information to make trading decisions. Price action traders do not rely on forex indicators or oscillators; instead, they base their trading decisions on the price chart.
Key topics in this area include the use of candlestick charts, providing information about entry prices, closing prices, and price highs and lows to traders. Traders use candlestick charts to identify patterns such as bullish and bearish patterns and pin bars, which indicate trend continuation or reversal.
Price Action Trading Tutorial
Learning price action trading requires a comprehensive understanding of its methodology and application in financial markets. Here are some steps to follow when practicing this method.
Step 1: Introduce Candlestick Charts
The first step in learning price action is to introduce candlestick charts to traders. This involves explaining what a candlestick chart is and how to read it. Traders need to understand various components of candlestick charts, such as the body and shadow, and how they relate to price movements of financial instruments. To delve deeper into this topic, refer to the article on types of charts in Forex on the website.
Step 2: Identify Price Action Patterns
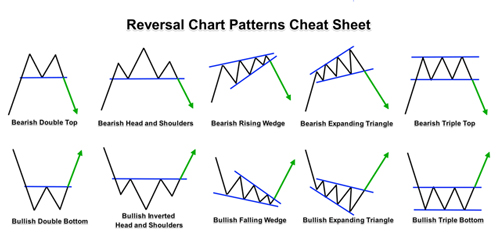
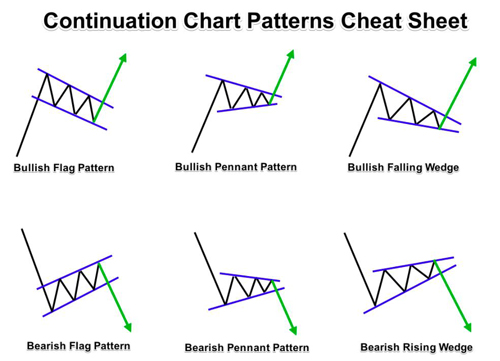
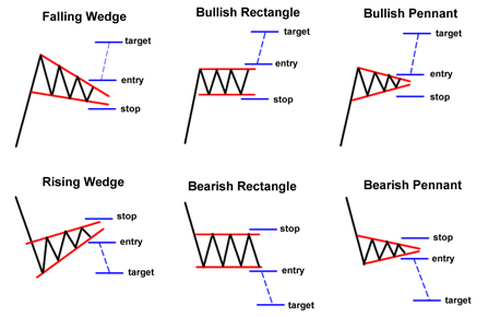
The next step is identifying various patterns in price action trading that traders can use to make decisions about their trades. In the continuation of this article, these patterns are introduced. This includes educating traders on how to identify bullish and bearish patterns, inside bars, pin bars, and other patterns indicating trend continuation or reversal. Recognize common chart patterns like triangle chart patterns, head and shoulders patterns, and flag chart patterns, which can signal potential market moves.
Step 3: Risk Management
Risk management is an essential aspect of trading, and learning how to manage risk when trading based on price is crucial. Traders need to understand the importance of setting stop-loss orders, how to effectively use them, and comprehend the concept of risk-to-reward ratio and how to calculate it.
Step 4: Introduce Trading Strategies
Once traders have a complete understanding of candlestick charts, price action patterns, and risk management, the next step is familiarizing themselves with various trading strategies that can be used in financial markets. Some commonly used strategies include pin bar strategy, inside bar strategy, and engulfing bar strategy. These strategies involve using different price patterns to make decisions in trades, and traders need to know how to effectively apply them in different market conditions.
After traders have a complete understanding of price action and different strategies, the next step is practice and reviewing their trades. Traders should practice using these strategies in a demo account and review their trades to identify areas for improvement. This helps traders refine their trading strategies and enhance their performance in financial markets.
Price Action Patterns
The most important topic in the field of price action trading is its patterns present in financial markets, each with its unique characteristics and consequences for traders. Here are some of the most common patterns:
Trending Pattern: This pattern occurs when a financial instrument consistently moves in a stable direction, either upwards or downwards. Traders in an uptrend look for higher highs and lows, while in a downtrend, they look for lower highs and lows.
Range-bound Pattern: This price action pattern occurs when a financial instrument moves within a defined price range. Traders, in making decisions about trades, look for support and resistance lines within the range.
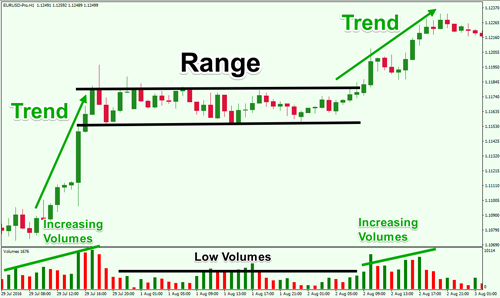
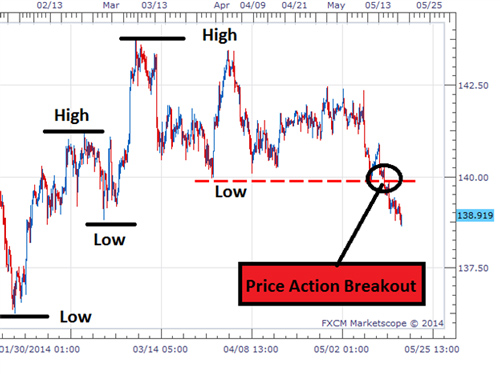
Breakout Pattern: The breakout pattern occurs when a financial instrument breaks out of a range-bound pattern. Traders look for a breakout above or below the established range, signaling a potential reversal in the trend.
 Reversal Pattern: The reversal pattern occurs when a financial instrument changes direction, usually after reaching a level of support or resistance. Traders look for potential trend changes by identifying reversal patterns, such as the head and shoulders pattern, which we have detailed in previous articles.
Continuation Pattern: The continuation pattern occurs when a financial instrument continues its current trend after a brief pause or correction. Traders, in search of entry opportunities in the direction of the trend, look for continuation patterns such as the flag chart pattern in Forex. This pattern has been discussed thoroughly in previous articles on the site, and we strongly recommend reading it for a comprehensive understanding.
Consolidation Pattern: The consolidation pattern occurs when a financial instrument moves within a narrow and tight range, often after a strong trend. Traders look for a breakout above or below the consolidation range to signal a continuation or reversal of the trend.
Candlestick Patterns: Candlestick patterns involve analyzing the shape and position of candles on a chart to identify reversals or continuation of a trend. Some common candlestick patterns include dojis, hammers, and shooting stars.
Traders use these price action patterns to identify opportunities and make informed decisions. It’s important to note that while these patterns can be useful, they are not infallible and should always be used in conjunction with other technical analysis tools and risk management strategies.
An example of Price Action Trading
An example of price action in forex is the “double top” pattern. This is a bearish reversal pattern that forms when the price of a currency pair reaches a high point, retraces, and then rises again to the same peak before experiencing a significant decline. The pattern resembles two peaks with almost equal heights and a trough in between.
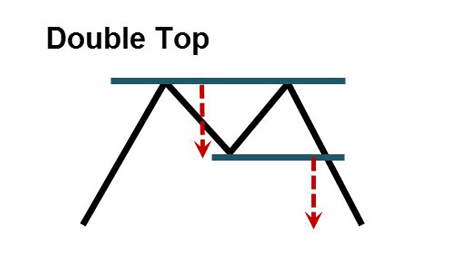
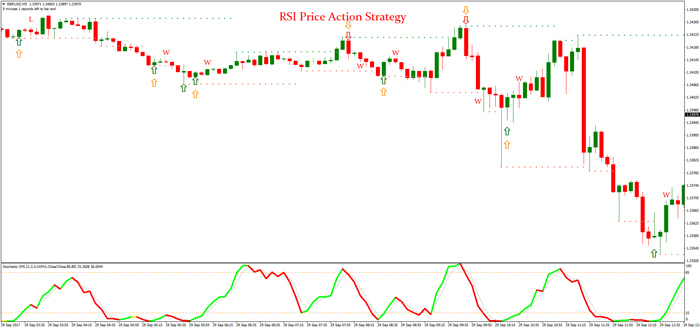
Traders who identify this pattern may be looking to enter a selling position, as it indicates that the price has reached a resistance level and is likely to fall. They may place a stop-loss order above the double top to protect against potential losses. Additionally, traders may seek confirmation of the pattern through other forex indicators, such as bearish divergence in the Relative Strength Index (RSI). For a better understanding, you can read the article on trading with the RSI indicator.
It’s important to note that while the double top pattern can be a reliable indicator of a bearish reversal, it is not foolproof. False signals may occur, and traders should always practice proper risk management and use additional technical analysis tools to confirm the pattern before entering a trade.
Pros and Cons of Price Action
After learning about price action, it is important to understand that this method, like other approaches, has both its advantages and disadvantages. Traders should be aware of both aspects before deciding to incorporate this method into their trading strategies.
Advantages of Price Action
- Simple and Easy to Learn: Price action trading is a straightforward method to learn. It doesn’t require the use of complex indicators or oscillators, which can be confusing for beginners.
- Concrete and Unambiguous: This strategy is based on a concrete and unambiguous interpretation of price movements. It eliminates the subjectivity and bias that can arise when using indicators.
- High Probability Trades: Known for generating high-probability trades as traders look for patterns indicating a trend continuation or reversal, which often leads to successful outcomes.
- Versatile: Price action can be applied to any financial instrument and in any market condition, including forex, stocks, commodities, and other financial markets.
- Compatible with Other Strategies: It can be combined with other trading strategies, such as fundamental analysis in forex and technical analysis, to produce more accurate trade signals.
Disadvantages of Price Action
- Requires Patience and Discipline: This approach demands patience and discipline. Traders need to wait for suitable pattern formations before entering a trade, which can be challenging for those seeking quick profits.
- Subject to False Signals: The strategy is prone to false signals. Traders must be able to differentiate between genuine and false signals to avoid executing losing trades.
- Experience and Skill Needed: Effective use of price action requires experience and skill. Traders need to be adept at reading candlestick patterns and accurately identifying trends.
- May Miss Some Trades: Traders using this strategy might miss some profitable trades because they focus only on specific patterns. This means they could miss out on trades that don’t align with their criteria.
- No Guarantee: Like any other trading strategy, price action trading provides no guarantee of success. Traders should be aware that losses may occur when using this method.
Conclusion
In summary, Brokerland has provided an education on price action trading, a simple yet effective method for trading in financial markets. The strategy involves analyzing price movements using candlestick charts and identifying patterns indicative of trend continuation or reversal. Another variant of this method, called Price Action RTM, has been covered in other articles on the site, which you may find beneficial to read.
Price action necessitates a comprehensive understanding of the methodology and its application in financial markets. Traders aspiring to become successful in trading must comprehend candlestick charts, patterns, risk management, and various trading strategies. While price action trading is a straightforward approach, it requires patience, discipline, and skill to be used effectively.
Traders should also be mindful that this methode is susceptible to false forex signals and does not guarantee success. By weighing the advantages and disadvantages of this method, traders can make informed decisions about its use in their trading strategies.


