

What you are about to read:
Forex trading can be a complex and challenging activity, but with proper knowledge and strategy, it can become a very profitable venture. One of the strategies that has gained popularity in recent years is the Wedge chart pattern. In this article, Brokerland will explain what this pattern strategy is and how to use it in Forex trading.
What is a Wedge Pattern?
The Wedge pattern is a technical analysis tool used by traders to identify a reversal or continuation trend in the market. It is a triangular-shaped pattern created when two trend lines converge, forming a narrow price range between the high and low of an asset. Depending on the direction of the trend lines, this pattern can be either bullish or bearish.
There are two types of Wedge patterns: Rising Wedge and Falling Wedge. When both support and resistance lines slope upwards, a bullish pattern is formed. Conversely, a neutral pattern occurs when both support and resistance lines slope downwards. The Rising Wedge pattern indicates a bearish reversal pattern, while the Falling one indicates a bullish reversal pattern.
Rising Wedge Pattern
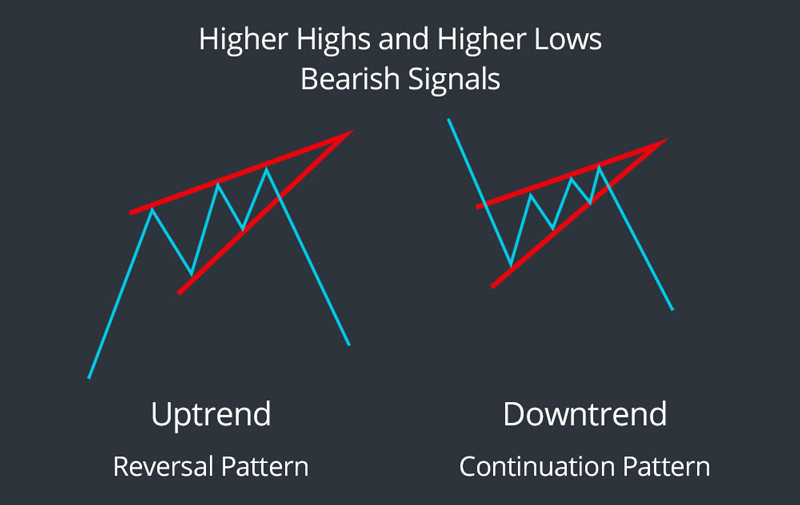
This pattern actually represents bearish signals, forming when the trading range narrows over time but shows a definite upward slope. This means that, unlike ascending triangles, both the next low and high prices in the pattern will increase as the trading range narrows towards the pattern apex.
As bearish signals, these patterns usually form at the end of a strong upward trend, indicating a reversal. However, they can occasionally form in the middle of a strong downward trend, in which case they are contrary to the main price movement. In this scenario, the downward movement at the end of the Rising Wedge chart pattern continues the main downward trend. The two examples of this pattern are illustrated below for better understanding.
Falling Wedge Pattern
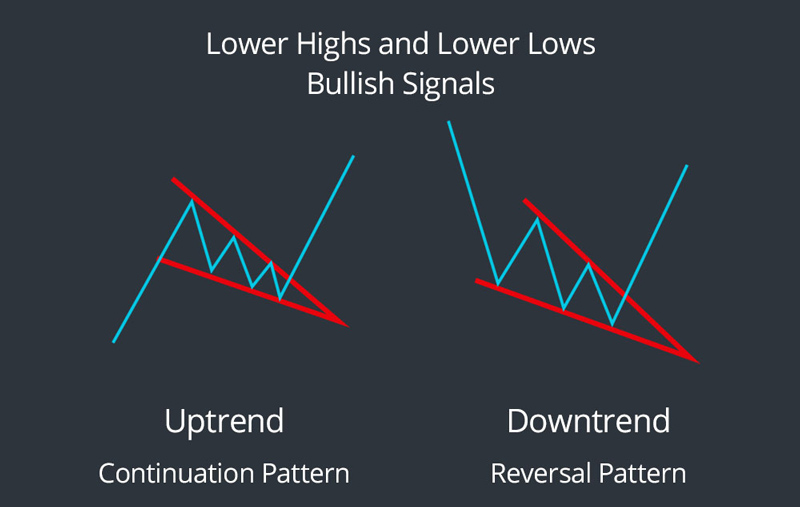
The Falling Wedge pattern is, in fact, the reverse of the previous type and is always considered bullish signals. They occur when a narrow descending trading range has a slope, so that with the progress of trades, the next high and low within the pattern decrease.
Falling Wedges are usually signals of a reversal that occur at the end of a strong downtrend. However, they can also occur in the middle of a strong uptrend, in which case the upward movement at the end of the pattern continues the overall upward trend. You can see these two types below.
Trading the Wedge Pattern
Trading this pattern can be a profitable strategy if you know how to identify it and use it to your advantage. Here are several steps to follow when trading:
Step 1: Identify the Wedge chart Pattern
The first step in this strategy is to identify it on the price chart. To do this, look for two converging trendlines forming a triangular shape. The trendlines should connect the highs and lows of the asset’s price movement. Once you’ve identified the pattern, you can move on to the next step.
Step 2: Determine the Trend Direction
After identifying the pattern, the next step is to determine the trend direction. If the Wedge pattern is ascending, it indicates a bullish reversal. Conversely, if it’s descending, it indicates a bearish reversal.
Step 3: Wait for a Breakout
The next step in the is to wait for a breakout. A breakout occurs when the asset’s price moves beyond one of the trendlines. If the asset’s price in an ascending Wedge falls below the support line, it indicates a bearish breakout. Conversely, if the asset’s price in a descending pattern rises above the resistance line, it indicates a bullish breakout.
Step 4: Take a Position
When a breakout occurs, you can take a position in the direction of the breakout. If the asset’s price in an ascending Wedge pattern falls below the support line, you can take a short position. On the other hand, if the asset’s price in a descending pattern moves above the resistance line, you can take a long position.
Step 5: Set Stop Loss and Take Profit Levels
Setting forex orders such as stop-loss and take-profit levels is crucial when executing a trade. These levels help limit your losses and prevent margin calls and stop outs. The levels you choose should be based on your risk tolerance and trading strategy.
Step 6: Monitor the Trade
After each trade, even when using a forex expert advisor, closely monitor the price movement. Adjust your stop-loss and take-profit levels accordingly. It’s also essential to be patient and not close the trade too early or too late.
Pros and Cons of the Wedge Pattern Strategy
Trading with the Wedge pattern has several advantages and disadvantages:
Pros:
- Easy Identification: The Wedge chart pattern is easily identifiable on the chart, making it an ideal strategy for novice traders.
- High Probability: This method is a high-probability trading strategy, serving as a reliable indicator for trend reversals.
Cons:
- False Breakouts: False breakouts may occur, leading to losses for traders.
- Timing: Predicting the timing of a breakout can be challenging, resulting in missed opportunities.
- Market Volatility: This pattern may not perform well in highly volatile markets.
- Subjectivity: The Wedge pattern is subjective, and different traders may draw trendlines differently, leading to different interpretations.
Tips for Trading this Pattern
To increase the chances of success when trading this pattern, consider the following tips:
Look for Confirmation: Look for other technical indicators or fundamental factors supporting the Wedge pattern to increase the likelihood of a successful trade.
Wait for Confirmation: Before executing a trade, wait for confirmation of the breakout.
Risk Management: Use stop-loss levels to effectively manage risk and prevent significant losses and margin calls.
Use Multiple Timeframes: Confirm the Wedge pattern using multiple timeframes to enhance the probability of a successful trade.
Practice: Practice using this pattern on a demo account before implementing it in a live account.
Conclusion
The Wedge pattern is a reliable and versatile trading strategy that can be used in any market and timeframe. Its easy identification and high success probability make it an ideal strategy for traders, especially beginners. However, it’s essential to consider the drawbacks and use risk management techniques to minimize potential losses.
By following the tips mentioned in this article and practicing on a demo account, traders can successfully incorporate this pattern into their forex trading strategy. If interested, you can explore other pattern strategies such as the Rectangle chart Pattern strategy or other topics covered in previous articles on the site.


