


What you are about to read:
The attractiveness of the double top and double bottom pattern lies in its ability to reveal hidden dynamics of supply and demand. These patterns, identified by peaks or troughs that are distinctly separated by an inverse in price direction, serve as strong indicators of trend reversal, heralding a shift in sentiments from bullish enthusiasm to cautious doubt or vice versa.
In this comprehensive article to learn forex, Brokerland embarks on a journey into the heart of this double tops and double bottoms pattern, elucidating its complexities, significance, and implications for traders navigating the turbulent waters of financial markets. Additionally, we will thoroughly examine strategies and methods for utilizing them in trading.
Double Top and Double Bottom Pattern in Forex
In forex trading, there are numerous patterns for predicting future market movements, many of which, such as the rectangle pattern, triangle pattern, wedge pattern, flag pattern, and head and shoulders pattern, have been taught in Forex education by Brokerland in the past. Another harmonic pattern in forex is the double top and double bottom pattern, which signals a reversal in trend. Here is a review of both types of patterns:
Double Top Pattern
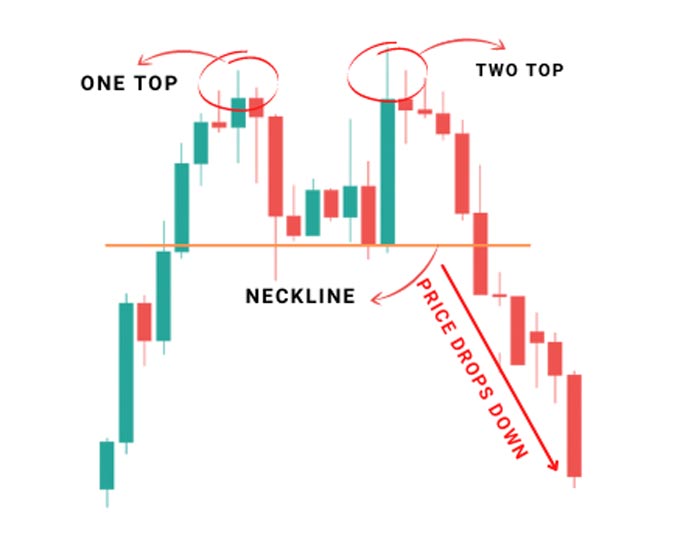
This type of double tops and double bottoms pattern occurs when the price of a currency pair reaches a ceiling or high and then retreats, then before declining, ascends again to the same previous ceiling level. Visually, this pattern resembles the letter “M”, with two distinct peaks separated by a trough (a reversal point between two peaks).
The double top and double bottom pattern indicates that buyers are exhausted at that level and are unable to push the price higher, often indicating a potential reversal in trend from bullish to bearish. Traders typically look for confirmation signals such as breaking below the “neckline,” which is a line connecting the lowest points between the two peaks, to confirm the pattern.
Double Bottom Pattern
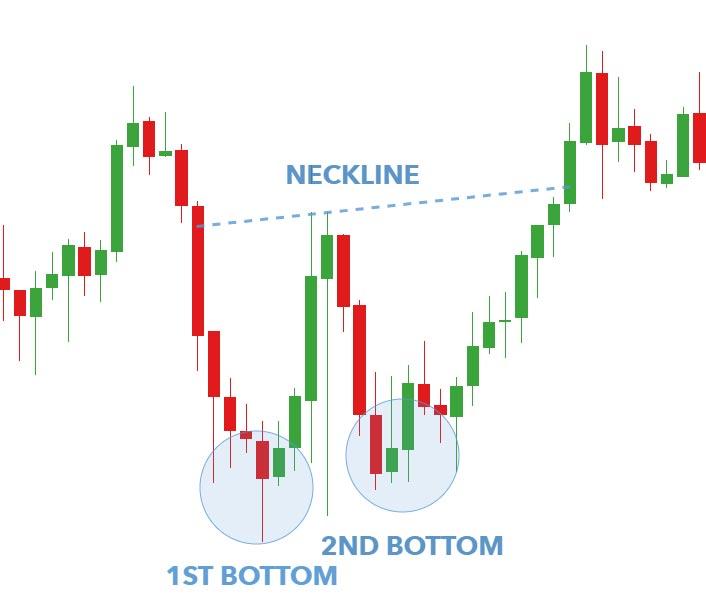
Another type of double tops and double bottoms pattern, conversely, forms a double bottom pattern when the price of a currency pair reaches a bottom, moves upwards, creates a double bottom pattern, and then retraces back to the same bottom level before ascending again. This pattern resembles the letter “W”, with two distinct troughs separated by a peak (a reversal point between two troughs).
Similar to the double top and double bottom pattern, the double bottom pattern indicates a potential reversal in trend from bearish to bullish. Traders typically confirm the pattern by waiting for a breakout above the neckline, which is a line connecting the highs between the two troughs.
The double tops and double bottoms pattern is important because it reflects changes in market sentiments and provides opportunities for traders to enter profitable trades at potential turning points in the market. However, it is essential to note that although the double tops and double bottoms patterns can be powerful indicators, they are not foolproof and should be used in conjunction with other technical analysis tools and risk management strategies for informed decision-making in trading.
Identifying the Double Tops and Double Bottoms Pattern
Identifying the double top and double bottom patterns on a price chart involves recognizing specific price movements that form these patterns. Here is how to identify each pattern:
Double Top Pattern:
- Look for an uptrend in price action.
- Identify a significant high formed by the price, followed by a retracement where the
- price decreases from the peak.
- Watch for the next rally attempt that tries to reach the previous peak but fails to
- surpass it, forming the second peak almost at the same level as the first peak.
- Pay attention to the trough formed between the two peaks, indicating a change in
- direction between rally attempts.
- When the second peak is formed, the pattern resembles the letter “M” with two
- peaks and a trough in between.
Double Bottom Pattern:
- Look for a downtrend in price movement.
- Identify a significant low formed by the price, followed by a retracement where the
- price increases from the lowest level.
- Watch for the subsequent decline that again observes the previous retracement but
- fails to break below it, forming a second trough almost at the same level as the first trough.
- Pay attention to the peak formed between the two troughs, indicating a reversal between downward attempts.
- When the second trough is formed, the pattern resembles the letter “W” with two troughs and a peak in between.
Both types of double tops and double bottoms pattern require at least two peaks or troughs with a retracement between them. Peaks or troughs should be almost at the same price level to qualify as double top and double bottom patterns.
The formation of the pattern should occur within a reasonable time frame, usually ranging from a few days to a few weeks depending on the chart’s time frame. Volume analysis can complement pattern identification. Generally, a decrease in volume during the formation of the double tops and double bottoms patterns followed by an increase in volume after pattern completion may strengthen the pattern’s validity.
Trading the Double Tops and Double Bottoms Patterns
Trading with double tops and double bottoms patterns in forex involves a combination of pattern identification, confirmation, entry, risk management, and exit strategies. Here is a step-by-step guide on how to effectively trade these patterns:
- Pattern Identification: Identify the double top and double bottom patterns on forex price charts. Look for two distinct peaks or two distinct troughs separated by a retracement.
- Confirmation: Wait for confirmation of the double tops and double bottoms patterns before entering a trade. Confirmation often accompanies a breakout below the neckline for the double top pattern or a breakout above the neckline for the double bottom pattern. Look for additional confirmation signals such as volume patterns, candlestick patterns, or divergence with oscillators like the Relative Strength Index (RSI).
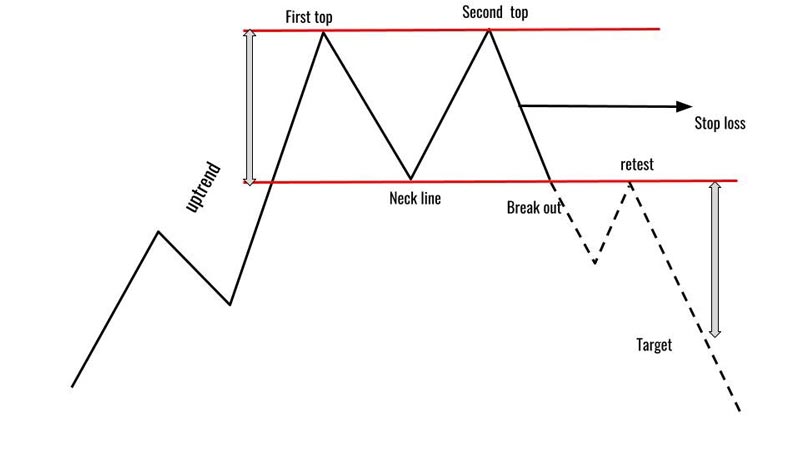
- Entry and Stop Loss: For the double top pattern, enter a short position after the price breaks below the neckline. For risk management, place a stop loss order above recent swing highs. For a double bottom pattern, enter a long position after the price breaks above the neckline. Place a forex order, stop loss, below recent swing lows.
- Setting Targets: Determine price targets based on the height of the double top and double bottom patterns. For a double top pattern, measure the distance between the peak and the neckline and extend it from the breakdown point downwards. For a double bottom pattern, measure the distance between the trough and the neckline and extend it from the breakout point upwards. Additionally, consider using support and resistance levels or Fibonacci retracement levels as potential targets.
- Risk Management: When trading with double tops and double bottoms patterns, employ appropriate risk management techniques like any other trading method to protect your capital. This includes setting position sizes based on risk tolerance, maintaining a proper risk/reward ratio, adhering to suitable stop loss levels, and paying attention to the mentioned tips for avoiding stop hunting. Also, avoid excessive leverage or risking a significant portion of your capital in a single trade and margin calls.
- Review and Adjustment: After the trade, review the results to learn from successes and mistakes. Keeping a trading journal and analyzing trading performance helps adjust your trading strategy based on real-time market conditions and feedback from your trades.
Positive and Negative Aspects
Every strategy, from martingale to even Gann Theory, has its strengths and weaknesses. Understanding the strengths and weaknesses of the double top and double bottom patterns is also crucial for forex traders. Here are the positive and negative aspects of these patterns:
Positive Aspects of the Double Top and Double Bottom Patterns
Clear Reversal Signals: The double tops and double bottoms patterns often provide clear signals of a trend reversal. When these patterns form after a prolonged trend, they can indicate a significant change in market sentiment.
Easy Identification: Identifying these patterns on price charts is relatively straightforward and accessible to traders at all levels of experience. Distinct peaks and troughs separated by a retracement are visually recognizable, and they can be confirmed with basic technical analysis tools.
Risk Management: Trading with the double top and double bottom patterns allows traders to implement effective risk management strategies. By placing stop-loss orders beyond the pattern confirmation points, traders can limit potential losses if the pattern fails to materialize.
Profit Potential: Successful trading with double top and double bottom patterns can lead to significant profit opportunities. If the pattern is confirmed and prices move as expected, traders can capitalize on the subsequent reversal trend and potentially achieve substantial profits.
Negative Aspects
False Signals: One of the primary drawbacks of the double tops and double bottoms patterns is the potential for false signals. Not all formations lead to a trend change, and some patterns may fail to confirm, resulting in losses for traders who enter positions prematurely.
Subjectivity: Identifying these patterns requires subjective interpretation, which can lead to inconsistencies among traders. What one trader perceives as a double bottom or double top pattern, another trader may see differently, leading to confusion and conflicting signals.
Market Noise: In volatile or choppy market conditions, these patterns may be less reliable. Price fluctuations and irregular movements can obscure the formation of these patterns or lead to false breakouts, making it difficult to distinguish true signals from noise.
Limited Timeframe: double top and double bottom patterns typically form within a relatively short timeframe, ranging from a few days to a few weeks. As a result, traders who rely solely on these patterns may miss out on longer-term trend reversals or fail to capture broader market dynamics.
Summary of double tops and double bottoms Patterns Review
Identifying double tops and double bottoms patterns is a vital skill for traders, as these patterns can provide valuable insights into potential trend changes. By closely observing price movements and recognizing the distinctive features of these patterns on price charts, traders can anticipate shifts in market sentiment and make informed trading decisions. Practice and experience are essential for strengthening this skill, as traders develop their abilities to identify and interpret these patterns accurately.
However, amidst the appeal of double topand double bottom patterns, traders must be aware of the inherent risks associated with trading in financial markets. While these patterns offer valuable insights, they are not foolproof predictors of future price changes. Prudent risk management, coupled with a comprehensive approach to trading that includes fundamental analysis, various forex indicators, and market sentiment, remains a priority.


