What is Ichimoku Cloud and How To Use it in Trading?

What is Ichimoku Cloud and How To Use it in Trading?

Ichimoku Kinko Hyo, also known as Ichimoku Cloud or simply Ichimoku, is a popular technical analysis tool used by Forex traders to analyze markets and identify potential trading opportunities. Developed by Japanese journalist Goichi Hosoda in the late 1930s, the Ichimoku indicator has gained significant popularity in recent years for its ability to provide traders with a comprehensive view of market direction, trends, and support and resistance levels at a glance.

In this article from the Brokerland website, we will learn forex trading and delve into the basic principles and teachings of Ichimoku, how it functions, and its use in making more informed trading decisions in the Forex market.

What is Ichimoku Cloud?

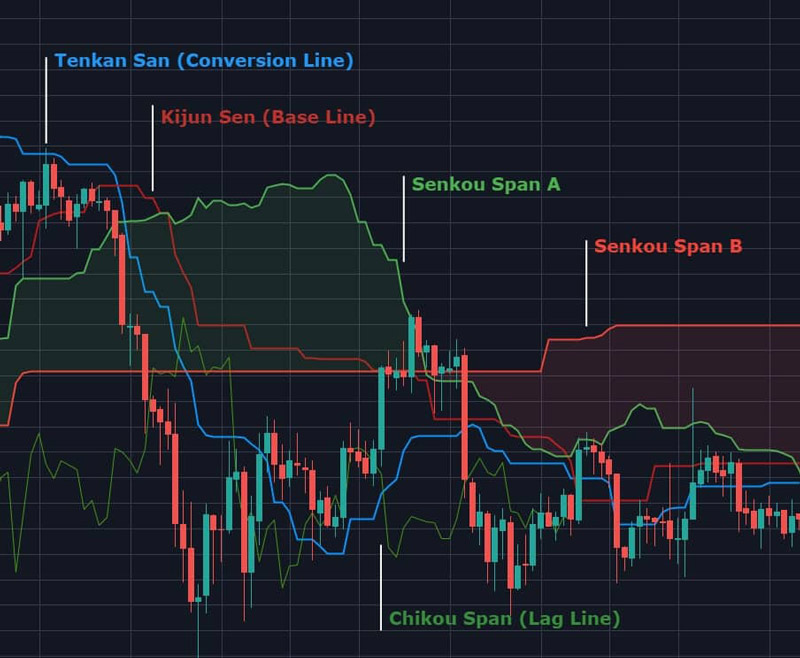
The Ichimoku indicator is a combination of several forex indicators that work together to present a complete picture of the market to traders. The five key elements of this indicator are:

Tenkan-sen: Also known as the Conversion Line, this is a short-term moving average that measures the average price over the last 9 periods.

Kijun-sen: Also known as the Base Line, this is a long-term moving average that measures the average price over the last 26 periods.

Senkou Span A: Also known as the leading span A, this is the midpoint between the Tenkan-sen and Kijun-sen lines, projected forward by 26 periods.

Senkou Span B: Also known as the leading span B, this is the midpoint between the highest high and lowest low over the past 52 periods, projected forward by 26 periods.

Kumo: Also known as the Ichimoku cloud, this is the shaded area between Senkou Span A and Senkou Span B. The color of the cloud depends on whether Senkou Span A or B is higher at any given time.

What is Ichimoku Cloud?

Ichimoku Tutorial

The Ichimoku Cloud is designed to assist traders in identifying the overall forex trend of the market and potential support and resistance levels. Here is a brief overview of how to use each element of this indicator:

  1. Tenkan-sen: When the Tenkan-sen line crosses above the Kijun-sen line, it is considered a bullish signal. Conversely, when the Tenkan-sen line crosses below the Kijun-sen line, it is considered a bearish signal.
  2. Kijun-sen: The Kijun-sen line is used to identify the overall market trend. When prices are above the Kijun-sen line, the market is considered in an uptrend. Conversely, when prices are below the Kijun-sen line, the market is considered in a downtrend.
  3. Senkou Span A and Senkou Span B: The space between the Senkou Span A and Senkou Span B lines is known as the Ichimoku cloud. When prices are above the cloud, it is a bullish signal, and when prices are below the cloud, it is a bearish signal. Additionally, the thickness of the cloud can be used to gauge the strength of support or resistance levels.
  4. Kumo: The color of the Ichimoku cloud is determined by whether Senkou Span A or B is higher at any given time. When the cloud is green, it is a bullish signal, and when the cloud is red, it is a bearish signal.

How to use Ichimoku Indicator in Forex Trading?

Now that we are familiar with the concept and basic principles of the Ichimoku indicator, let’s take a look at how to use it in Forex trading. One of the primary advantages of the Ichimoku Cloud is its ability to provide a clear and comprehensive view of the market at a glance, which can be especially useful for traders who prefer a visual approach to technical analysis. Here are a few strategies that traders can employ when using this indicator in Forex trading:

Trend Identification

One of the primary applications of the Ichimoku indicator is identifying the market trend. Traders can use the Kijun-sen line to identify the overall market trend. When prices are above the Kijun-sen line, the market is in an uptrend, and when prices are below the Kijun-sen line, the market is in a downtrend.

Confirmation of Trend Reversal

The Tenkan-sen and Kijun-sen lines can be used to confirm a trend reversal. When the Tenkan-sen line crosses above the Kijun-sen line, it is considered a bullish signal, indicating that the market may shift from a downtrend to an uptrend. Conversely, when the Tenkan-sen line crosses below the Kijun-sen line, it is considered a bearish signal, indicating a potential shift from an uptrend to a downtrend.

Identification of Support and Resistance Levels

The Ichimoku cloud can be used to identify support and resistance levels. When prices are above the cloud, it acts as a support level. Conversely, when prices are below the cloud, it acts as a resistance level. The thickness of the cloud can also be used to measure the strength of support or resistance.

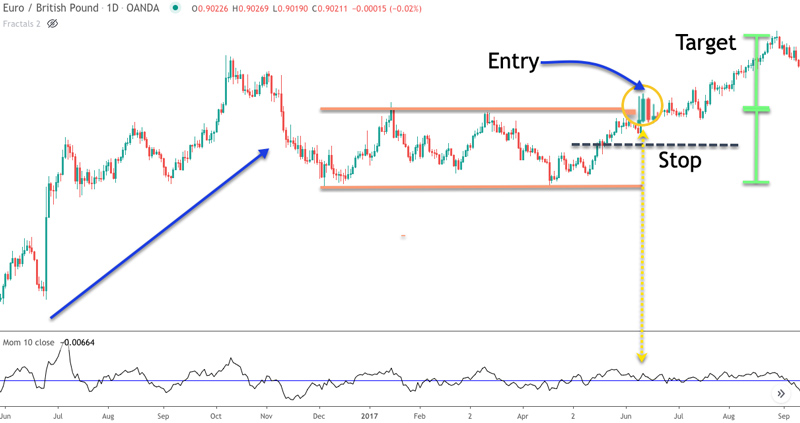
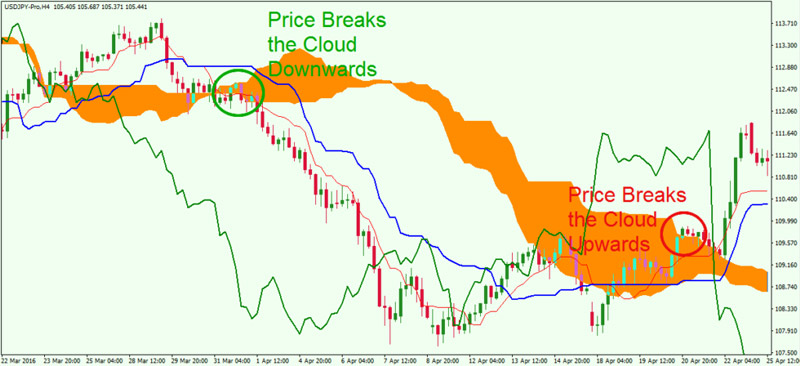
Breakouts Trading with Ichimoku cloud

Traders can use the Ichimoku-cloud for trading breakouts. When the price breaks above the cloud, it is considered a bullish signal, indicating that the market may enter an uptrend. Conversely, when the price breaks below the cloud, it is considered a bearish signal, indicating a potential entry into a downtrend.

How to use Ichimoku Indicator in Forex Trading?

Use multiple time frames

Traders can utilize this indicator across various time frames to gain a better understanding of the overall market trend. For instance, a trader might use the daily chart to identify the general market trend and a 4-hour chart to pinpoint potential entry and exit points.

Limitations of the Ichimoku Cloud Indicator

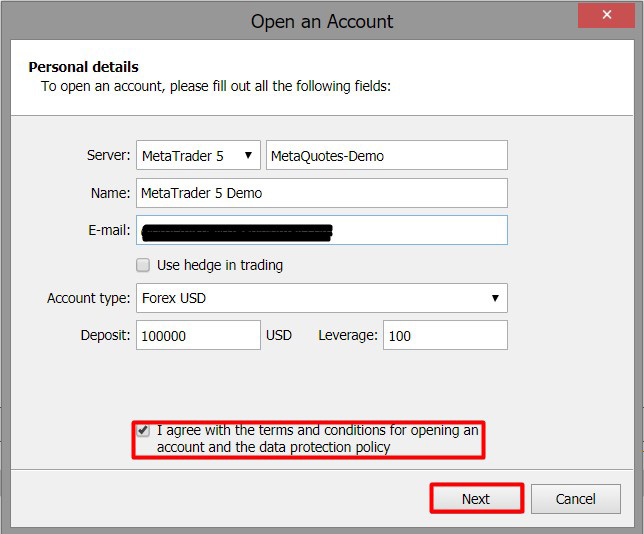
So far, we’ve covered the Ichimoku tutorial and outlined its advantages. While this indicator is a powerful technical analysis tool, it has its limitations. Like any other technical analysis tool such as Fibonacci or pivot points indicator, the effectiveness of the Ichimoku indicator depends on the trader’s knowledge and experience. Traders should take the time to study various elements of the indicator and practice using it in a demo account before applying it to real trades. Here are some limitations to keep in mind:

Lagging Indicators: This indicator is based on moving averages, which are lagging indicators. This means the indicator may not provide real-time market information to traders.

Complexity: The Ichimoku Cloud is a complex tool that may take some time to master. Traders may need time to study the different elements of the indicator and how they interact with each other.

Incorrect Signals: Like any technical analysis tool, this indicator is not 100% accurate. Traders may receive incorrect signals that, if acted upon, could lead to losses.

Summary

The Ichimoku Cloud indicator is a popular technical analysis tool used by forex traders to analyze the market and identify potential trading opportunities. The indicator combines several elements, including moving averages and support/resistance levels, to provide traders with a comprehensive view of the market at a glance. Traders can use it to identify market trends, confirm trend changes, identify support and resistance levels, work with breakouts, and use multiple time frames for analysis.

While the Ichimoku indicator is a powerful tool, it’s crucial for traders to be aware of potential limitations, such as its lagging nature, complexity, and the possibility of incorrect signals.

In addition to the indicator, traders should use other technical analysis tools, such as candlestick patterns, chart patterns such as triangle patterns or head and shoulders pattern, and indicators like the Relative Strength Index (RSI) and Moving Average Convergence Divergence (MACD). By combining multiple technical analysis tools, traders can gain a fuller picture of the market and increase their chances of success.

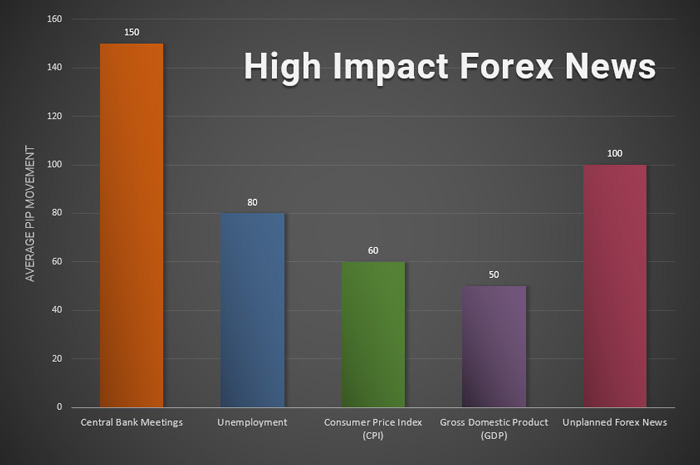
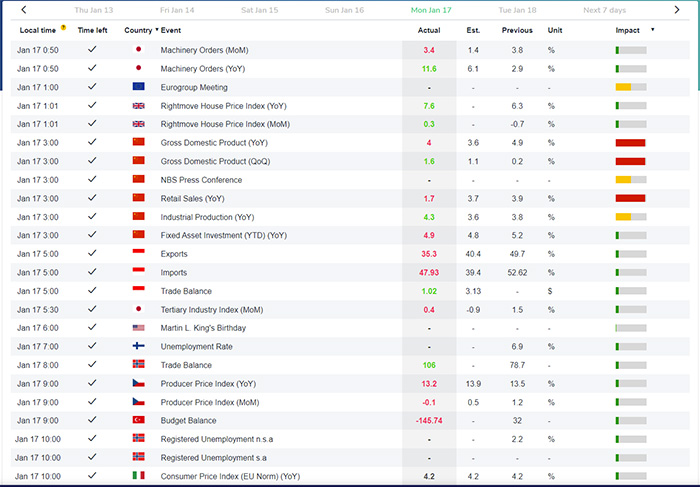
It’s also important for traders to have a thorough understanding of fundamental analysis, which includes analyzing forex news and economic and political events like interest rate that can impact the value of a currency. Traders who combine fundamental and technical analysis can make more informed trading decisions and reduce their risk exposure.

How To Trade Wedge Chart Patterns?

How To Trade Wedge Chart Patterns?

Forex trading can be a complex and challenging activity, but with proper knowledge and strategy, it can become a very profitable venture. One of the strategies that has gained popularity in recent years is the Wedge chart pattern. In this article, Brokerland will explain what this pattern strategy is and how to use it in Forex trading.

What is a Wedge Pattern?

The Wedge pattern is a technical analysis tool used by traders to identify a reversal or continuation trend in the market. It is a triangular-shaped pattern created when two trend lines converge, forming a narrow price range between the high and low of an asset. Depending on the direction of the trend lines, this pattern can be either bullish or bearish.

There are two types of Wedge patterns: Rising Wedge and Falling Wedge. When both support and resistance lines slope upwards, a bullish pattern is formed. Conversely, a neutral pattern occurs when both support and resistance lines slope downwards. The Rising Wedge pattern indicates a bearish reversal pattern, while the Falling one indicates a bullish reversal pattern.

Rising Wedge Pattern

This pattern actually represents bearish signals, forming when the trading range narrows over time but shows a definite upward slope. This means that, unlike ascending triangles, both the next low and high prices in the pattern will increase as the trading range narrows towards the pattern apex.

As bearish signals, these patterns usually form at the end of a strong upward trend, indicating a reversal. However, they can occasionally form in the middle of a strong downward trend, in which case they are contrary to the main price movement. In this scenario, the downward movement at the end of the Rising Wedge chart pattern continues the main downward trend. The two examples of this pattern are illustrated below for better understanding.

Rising Wedge Pattern

Falling Wedge Pattern

The Falling Wedge pattern is, in fact, the reverse of the previous type and is always considered bullish signals. They occur when a narrow descending trading range has a slope, so that with the progress of trades, the next high and low within the pattern decrease.

Falling Wedges are usually signals of a reversal that occur at the end of a strong downtrend. However, they can also occur in the middle of a strong uptrend, in which case the upward movement at the end of the pattern continues the overall upward trend. You can see these two types below.

Falling Wedge Pattern

Trading the Wedge Pattern

Trading this pattern can be a profitable strategy if you know how to identify it and use it to your advantage. Here are several steps to follow when trading:

Step 1: Identify the Wedge chart Pattern

The first step in this strategy is to identify it on the price chart. To do this, look for two converging trendlines forming a triangular shape. The trendlines should connect the highs and lows of the asset’s price movement. Once you’ve identified the pattern, you can move on to the next step.

Step 2: Determine the Trend Direction

After identifying the pattern, the next step is to determine the trend direction. If the Wedge pattern is ascending, it indicates a bullish reversal. Conversely, if it’s descending, it indicates a bearish reversal.

Step 3: Wait for a Breakout

The next step in the is to wait for a breakout. A breakout occurs when the asset’s price moves beyond one of the trendlines. If the asset’s price in an ascending Wedge falls below the support line, it indicates a bearish breakout. Conversely, if the asset’s price in a descending pattern rises above the resistance line, it indicates a bullish breakout.

Step 4: Take a Position

When a breakout occurs, you can take a position in the direction of the breakout. If the asset’s price in an ascending Wedge pattern falls below the support line, you can take a short position. On the other hand, if the asset’s price in a descending pattern moves above the resistance line, you can take a long position.

Step 5: Set Stop Loss and Take Profit Levels

Setting forex orders such as stop-loss and take-profit levels is crucial when executing a trade. These levels help limit your losses and prevent margin calls and stop outs. The levels you choose should be based on your risk tolerance and trading strategy.

Step 6: Monitor the Trade

After each trade, even when using a forex expert advisor, closely monitor the price movement. Adjust your stop-loss and take-profit levels accordingly. It’s also essential to be patient and not close the trade too early or too late.

Pros and Cons of the Wedge Pattern Strategy

Trading with the Wedge pattern has several advantages and disadvantages:

Pros:

  • Easy Identification: The Wedge chart pattern is easily identifiable on the chart, making it an ideal strategy for novice traders.
  • High Probability: This method is a high-probability trading strategy, serving as a reliable indicator for trend reversals.

Cons:

  • False Breakouts: False breakouts may occur, leading to losses for traders.
  • Timing: Predicting the timing of a breakout can be challenging, resulting in missed opportunities.
  • Market Volatility: This pattern may not perform well in highly volatile markets.
  • Subjectivity: The Wedge pattern is subjective, and different traders may draw trendlines differently, leading to different interpretations.

Tips for Trading this Pattern

To increase the chances of success when trading this pattern, consider the following tips:

Look for Confirmation: Look for other technical indicators or fundamental factors supporting the Wedge pattern to increase the likelihood of a successful trade.

Wait for Confirmation: Before executing a trade, wait for confirmation of the breakout.

Risk Management: Use stop-loss levels to effectively manage risk and prevent significant losses and margin calls.

Use Multiple Timeframes: Confirm the Wedge pattern using multiple timeframes to enhance the probability of a successful trade.

Practice: Practice using this pattern on a demo account before implementing it in a live account.

Conclusion

The Wedge pattern is a reliable and versatile trading strategy that can be used in any market and timeframe. Its easy identification and high success probability make it an ideal strategy for traders, especially beginners. However, it’s essential to consider the drawbacks and use risk management techniques to minimize potential losses.

By following the tips mentioned in this article and practicing on a demo account, traders can successfully incorporate this pattern into their forex trading strategy. If interested, you can explore other pattern strategies such as the Rectangle chart Pattern strategy or other topics covered in previous articles on the site.

How To Trade Rectangle Chart Patterns

How To Trade Rectangle Chart Patterns

Forex transactions are a popular method for investment and earning income in financial markets. However, successful trading requires understanding various chart patterns and effective analysis. One of the most popular and widely used patterns is the rectangle chart pattern.

In previous articles, BrokerLand introduced patterns such as the triangle chart pattern and flag patterns in forex trading. Here, we present another pattern: the rectangle pattern. This pattern is a continuation pattern that forms when the price of an asset trades within a rectangular range for an extended period. This pattern is characterized by two parallel horizontal lines, with the upper line acting as resistance and the lower line as support.

The strategy for the rectangle chart pattern believes that when the price breaks out of the pattern, it usually indicates a continuation of the existing trend. In other words, if the price was in an uptrend before the pattern, a breakout to the upside suggests a continuation of the uptrend. Conversely, if the price was in a downtrend before the pattern, a breakout to the downside indicates a continuation of the downtrend.

In this article, we will also examine how to identify and trade the rectangle pattern in forex, as part of the Brokerland forex learning.

Identifying the Rectangle Chart Pattern

Identifying the rectangle pattern is relatively simple. Traders can draw two horizontal trend lines connecting the price high and low. These trend lines should be parallel, indicating that the price is trading within a rectangular range.

It is essential to note that the reliability and validity of the pattern depend on the trading style and strategy. The pattern can occur on various time frames, from minutes to weeks. It is more reliable and valid when it occurs on longer time frames, such as daily or weekly charts.

Once the rectangle chart pattern is identified, traders can predict a breakout from it, which can lead to a significant price movement. As mentioned earlier, a breakout to the upside indicates a continuation of the uptrend, while a breakout to the downside indicates a continuation of the downtrend.

Identifying the Rectangle Chart Pattern

How To Trade Rectangle Pattern

Trading with the rectangle pattern requires a combination of technical analysis tools and trading strategies. Here are the steps to follow when trading with this pattern:

1. Identify theBrokerland Pattern

The first step is to identify the pattern on the forex chart. As mentioned earlier, this pattern is characterized by two parallel horizontal lines connecting the price high and low.

2. Determine the Breakout Direction

The second step is to determine the breakout direction. Traders can predict the breakout by analyzing the previous trend before the pattern formation. If the price was in an uptrend before the rectangle pattern, there is a higher probability of a breakout to the upside. Conversely, if the price was in a downtrend, there is a higher probability of a breakout to the downside. Be cautious of false breakouts during this stage.

3. Wait for the Breakout

The third step is to wait for the breakout to occur. Traders should closely monitor the price to identify signs of a breakout. It’s essential to note that false breakouts may occur, so traders should wait for confirmation before entering a trade.

4. Enter the Trade

The fourth step is to enter the trade after the breakout is confirmed. Traders can go long if the price moves upward or short if the price moves downward. Depending on the exit direction, the entry point should be slightly above or below the breakout point.

5. Set Stop-Loss and Take-Profit Levels

The fifth step involves setting forex orders (stop-loss and take-profit levels). The stop-loss level should be placed below the support line for long trades and above the resistance line for short trades. Take-profit levels can be determined using technical analysis tools such as Fibonacci retracement or by considering the risk/reward ratio.

6. Manage the Trade

The final step is to manage the trade by monitoring price action and adjusting stop-loss levels if necessary. Traders should also consider taking partial profits if the trade moves in their favor. It’s crucial to note that while the rectangle chart pattern can lead to significant price movements, it is not a guaranteed success. Traders should always practice proper risk management and have a trading plan in place.

How To Trade Rectangle Pattern

Several Rectangle Pattern Strategies

Here are several trading strategies that traders can use with the rectangle pattern:

  • Breakout Strategy

The breakout strategy involves waiting for the price to exit the pattern and entering a trade in the breakout direction. Traders can use technical analysis tools such as moving averages, trend lines, and oscillators to confirm the breakout.

  • Range Trading Strategy

This strategy with the rectangle pattern involves buying at support levels and selling at resistance levels. Traders can enter a long trade when the price reaches the support level and exit when the price reaches the resistance level. Conversely, traders can enter a short position when the price reaches the resistance level and exit when the price reaches the support level.

  • Price Action Rectangle Pattern Strategy

The price action strategy for trading with this pattern includes using price action and price movements alone to identify this pattern and trade the breakout. Traders can use candlestick patterns and chart patterns to identify the pattern and confirm the breakout.

Conclusion

In this article from Brokerland, the rectangle pattern was introduced which is a popular and common chart pattern in forex trading. This pattern is characterized by two parallel horizontal lines, with the upper line acting as resistance and the lower line as support. When the price breaks out of the rectangle pattern, it usually indicates a continuation of the existing trend.

Traders can use technical analysis tools and trading strategies to identify and trade this pattern. However, traders should always have proper risk management and a trading plan to ensure long-term success in forex trading.

What is Forex Sentiment Analysis?

What is Forex Sentiment Analysis?

Forex sentiment analysis is the process of using various tools and techniques to determine market emotions in the currency market. This method is a technical approach used to measure the level of positive or negative sentiments expressed in the market.

The goal of utilizing this information is to identify trading opportunities or risks. Here, Brokerland will discuss forex sentiment analysis, how it works, and its importance in trading.

Forex Sentiment Analysis – An Overview

Forex sentiment analysis is essentially the breakdown and analysis of market sentiments, meaning traders’ attitudes toward the market. This aspect can help traders understand whether the market is bullish or bearish, which is crucial as it can provide insights into the market’s mood and the direction it might take for traders. Various methods exist for conducting sentiment analysis, including using technical indicators, fundamental analysis, and social media analysis.

Technical Indicators in Sentiment Analysis

Technical indicators are tools used by traders to analyze price performance and identify trends in the forex market. Some popular technical indicators used in forex sentimental analysis include Moving Averages, Bollinger Bands, and the Relative Strength Index (RSI).

Moving Average or Moving Average is one of the most popular technical indicators used in forex trading. This indicator is essentially a line that represents the average price of a currency pair over a specific period and is used to identify trends in the market.

If the moving average is increasing, the market is considered bullish, and if it is decreasing, the market is considered bearish.

Bollinger Bands are another popular technical indicator used in forex trading, consisting of three lines: upper, middle, and lower bands. The upper band indicates an overbought level, and the lower band indicates an oversold level. The middle band represents the moving average. Bollinger Bands are used to identify fluctuations in the market.

The Relative Strength Index (RSI) is a momentum indicator used to measure the strength of a market trend. It is based on the ratio of average gains to average losses over a specific period. RSI ranges from 0 to 100. If RSI is above 70, the market is considered overbought, and if it is below 30, the market is considered oversold.

Fundamental Analysis

Fundamental analysis is the process of analyzing economic and financial data to determine the intrinsic value of an asset. This analysis is used to identify factors that may impact the value of money, such as interest rates, inflation, and gross domestic product growth.

Fundamental analysis can be used to determine the economic strength and potential direction of a currency. For example, if interest rates are high, it may attract foreign investors to invest in the country, increasing demand for the currency.

Social Media and Sentiment Analysis

Social media analysis is a technical technique used to measure the sentiments of traders and investors using social media platforms such as Twitter and Facebook. Traders and investors often express their opinions on these platforms, and their opinions can affect market sentiments and can be used in forex sentiment analysis.

Social media analysis can be used to measure the sentiments of traders and investors towards a specific currency pair. For example, if there is a lot of positive sentiment towards the USD/JPY pair, it may indicate an increase in the value of this pair.

Social Media and Sentiment Analysis

Importance of Forex Sentiment Analysis

Forex sentiment analysis is an essential tool for traders as it can provide insights into the market sentiment and potential direction it may take. This method can help traders identify potential trading opportunities or risks and make informed decisions.

For example, if sentiment towards a specific currency pair is bullish, a trader may decide to buy the currency pair with the anticipation of its value increasing. Conversely, if sentiments are bearish for a currency pair, a trader might decide to sell the currency pair, anticipating a decrease in its value.

Additionally, sentiment analysis can be used for risk management in trades. If sentiments are bearish for a specific currency pair, a trader might decide to set a stop-loss order to limit their losses in case the value of the currency pair decreases.

Forex sentiment analysis can be used in conjunction with other technical and fundamental analysis tools to enhance the accuracy of trading decisions. For instance, a trader may use technical indicators to identify trends in the market and use forex sentiment analysis to confirm their trading decisions.

Advantages of Forex Sentiment Analysis

The primary advantage of using this method is that a trader can gain a better overall understanding of what the majority of market participants feel about a market. Understanding the actions or sentiments of the “crowd” likely influences the potential direction of a currency pair, leading to potential market trends or reversals.

Disadvantages of Forex Sentiment Analysis

Forex sentiment analysis also has its drawbacks that novice traders should be aware of. Like any other form of analysis, this method does not always provide 100% accurate signals. Perhaps its most significant drawback is that it can be very subjective, meaning one analyst may interpret emotional data differently from another.

Moreover, some sentiment indicators may be slow to react to political or economic news events, which is why most traders consider other forms of analysis to deal with sudden changes in market conditions.

Final Thoughts

Forex sentiment analysis is a vital tool for traders as it can provide insights into the market sentiment and potential directions it may take. This method involves analyzing various factors that may impact market sentiments, including economic data, technical indicators, news, and social media sentiments.

Using technical indicators to identify forex trends in the market, fundamental analysis to determine the intrinsic value of currency, and analyzing social media sentiments to measure traders’ and investors’ sentiments on specific currency pairs can help traders identify potential opportunities or risks. In this way, this method becomes a crucial tool for traders aiming to succeed in the forex market.

Types of Forex Orders and How to Set Them

Types of Forex Orders and How to Set Them

Trading in the Forex market is a popular investment opportunity that allows individuals to buy and sell currencies to gain profits. One of the most crucial aspects of trading in this market is understanding the various types of Forex orders. These orders empower traders to specify particular parameters for their trades, assisting them in minimizing risk and maximizing returns. In this Forex tutorial from Brokerland, we will explore the types of orders in Forex and how to use them to enhance trading results.

Types of Forex Orders

As you may know, almost all transactions in the Forex market are carried out by placing various forex order. Therefore, familiarity with them is one of the most fundamental steps in starting to learn forex trading. Below, we will become acquainted with these cases in order.

Market Orders

This order is the most common type of forex order in trading. A market order is an instruction to buy or sell a currency at the current market price. When a trader places a market order, the trade is executed immediately at the best available price. This means that the trader receives the currency at the current available price, regardless of whether the price changes in the future or not.

Market orders are useful for traders who want to enter or exit a trade quickly without waiting for a specific price. However, these types of forex orders can also be risky, as the price of a currency can change rapidly. Traders using market orders should be aware of the existing risks and have a complete understanding of market conditions.

Types of Forex Orders

Limit Orders

The next type of Forex orders is limit orders, which allow traders to specify a particular price at which they want to buy or sell a currency. When a trader places a limit order, the trade is only executed when the currency reaches the specified price. For example, if a trader wants to buy a currency at a price of 1.2000, they can place a limit order at that price. If the currency reaches that price, the trade is executed.

These types of forex orders can be useful for traders who want to buy or sell a currency at a specific price, instead of the current market price (unlike traders mentioned in the market order who decided to buy the currency at the current market price). This can help reduce risk, as traders can specify a price within their risk tolerance range. However, these types of orders in Forex can also be risky, as the currency may not reach the specified price, and the trade may not be executed.

Limit Orders 

Stop Forex Orders

A stop order is a type of forex order that allows traders to specify a price at which they want to buy or sell a currency. When a trader places a stop order, the trade is only executed when the currency reaches the specified price. However, unlike the limit order mentioned above, a stop order is used to limit losses or protect profits.

In this type of Forex orders, there are two models of stop orders: stop-loss orders and take-profit orders. A stop-loss order is used to limit losses, while a take-profit order is used to protect profits. For example, if a trader buys a currency at a price of 1.2000, they can place a stop-loss order at 1.1950. If the currency falls to 1.1950, the trade is executed, and the trader limits their losses.

Stop orders can be useful for traders who want to limit their losses or protect their profits. However, this forex order can also be risky, as the currency may move quickly, and the stop order may not be executed at the desired price.

Stop Forex Orders

Trailing Stop Order

Trailing stop orders are another types of forex orders that allow traders to specify a particular price at which they want to buy or sell a currency, but with an added feature called “trail.”

When a trader places a trailing stop order, the trade is only executed when the currency reaches the specified price plus a specific distance determined by the trader as the trail value.

These types of Forex orders can be useful for traders who want to limit their losses or protect their profits while benefiting from price movements in the market. For example, if a trader buys a currency at a price of 1.2000, they can place a trailing stop order with a trail value of 50 pips.

If the value of that currency increases to 1.2050, the trailing stop order will also increase by 50 pips and reach 1.2000, effectively locking in a profit of 50 pips. Now, if the value of the currency falls, the trailing stop order does not move, effectively limiting the trader’s losses. Trailing stop orders can be especially useful in volatile markets where prices can change quickly. However, traders must be cautious in setting the trail value accurately to avoid being stopped out too soon and potentially missing out on substantial profits.

Trailing Stop Order

One-Cancels-the-Other Orders (OCO)

The next type of forex orders we’ll discuss is the One-Cancels-the-Other order, abbreviated as OCO. This order allows traders to execute two orders simultaneously and, if one is executed, automatically cancels the other. For example, a trader may want to buy a currency if it goes above a specific price or sell it if it falls below a certain price.

In this case, they can place two orders, one buy limit order and one sell limit order, simultaneously using an OCO order. If one of the conditions and orders is canceled, the other will be automatically canceled.

OCO forex orders can be useful for traders who want to take advantage of price changes but also want to limit their risk by having a stop-loss or take-profit order simultaneously. However, traders must be careful in setting up these types of forex orders accurately to prevent being stopped out too soon or letting profits run excessively.

OCO types of forex orders

How to place forex orders in MT4 Platform?

Now that we are familiar with different types of forex orders, it is essential to know how to set them. In previous articles, we introduced the MetaTrader 4 trading platform. Here, we will examine how to place the forex orders in this platform. There are several ways to do it:

Method 1: Order Management Window

Click on the “new order” icon in the toolbar, opening the forex order window. This option reveals the page related to order placement.

Method 2: Placing Various types of forex orders via Charts

Right-click on the chart, select “Trading,” and choose the appropriate option.

Method 3: Order Placement via Keyboard Shortcut

Press the keyboard shortcut ”, opening the order window. This method is straightforward and fast.

Method 4: Placing Types of Forex Orders using ‘One Click Trading’ Feature

Lastly, the fourth method involves using the ‘One Click Trading’ feature, displaying the buy/sell button directly in the upper-left corner of the chart. To activate this feature, go to Tools > Options > Trade and select “One Click Trading.” Keep in mind that before using this feature, you must accept the terms and conditions. This feature allows you to place all types of forex orders with just one click, so use it only if you know what you are doing.

Tips for Setting Forex Orders

Here some tips that help you in using different types of forex orders.

  1. Use of Stop Loss: Setting a stop loss is crucial for every trader to limit losses and manage risk. Always determine a stop loss for each trade and ensure it has enough distance from the entry price.
  2. Use of Take Profit or Limit Order: This type of forex order is another essential tool for risk management. It allows traders to lock in their profits at a predetermined level and can help prevent turning trades into losses.
  3. Be Aware of Market Fluctuations: Market fluctuations can impact order execution. When setting forex orders, consider the market fluctuations of the currency pair you are trading.
  4. Monitor Your Trades: Always keep an eye on your trades and adjust your orders if necessary. Market conditions can change rapidly, and being prepared to adapt to these changes is essential.

Conclusion

In conclusion, there are various types of forex orders, each with its own advantages and disadvantages. Market orders are the most common, but limit orders, stop orders, trailing stop orders, and OCO orders can be useful in specific conditions.

Traders must be careful when adjusting orders, understanding the associated risks, to maximize their profits and minimize losses. A thorough understanding of different types of forex orders can assist traders in making informed decisions and improving the outcomes of their trades.

What is a Demo Trading Account and how to open it?

Forex is an exciting and challenging financial market where traders engage in the buying and selling of various currency pairs. It stands as one of the world’s largest markets, with a daily average turnover exceeding 5 trillion dollars. However, due to the complexities involved in market analysis, risk management, and executing profitable trades, forex trading can be daunting for newer traders.

Fortunately, a Forex trading demo account provides an excellent opportunity for traders to practice and learn without risking real money, allowing them to gain skills before transitioning to live trading. In this article of learning forex, we will talk about what a demo trading account is and how to open it.

What is a Demo Trading Account?

A trading demo account is a virtual trading platform that simulates the real forex market. It offers a risk-free environment for traders to practice their trading strategies and enhance their skills. Operating with real-time market data, this account enables traders to execute trades just as they would in a real or live account. However, unlike a real account, a demo or practice account involves no real money. Instead, it opens with virtual funds that traders can use to trade various currency pairs.

Advantages of Trading Demo Account

The advantages of a demo account are considerable. It allows traders to gain experience in the forex market without putting their capital at risk, particularly crucial for newer traders unfamiliar with market complexities. With this account, traders can test their strategies, analyze market trends, and engage in risk-free trading. This helps traders build confidence in their trading abilities, enabling them to make better decisions when transitioning to live trading with real money.

Advantages of Trading Demo Account

Another advantage of using a demo trading account is that it provides traders access to a wide range of tools and resources. These include real-time market data, technical analysis tools, charting software, and trading indicators. Traders can utilize these resources to gain insights into the market, identify trends, and make informed decisions in their trades.

Additionally, some forex brokers offer educational resources such as webinars, tutorials, and e-books that traders can use to enhance their skills.

A trading demo account is also useful for experienced traders looking to test new strategies or refine their existing ones. The forex market is continually evolving, with new trading strategies and techniques emerging regularly. With this account, experienced traders can test these new strategies without risking their capital. This allows them to evaluate the effectiveness of these strategies and make adjustments before using them in a live account.

Using a demo account is beneficial for traders in developing patience and discipline, essential features for successful trading. The forex market is volatile, and prices can quickly fluctuate, often leading to emotional reactions from traders.

However, by opening an account, traders can practice patience and discipline in executing their trades. They can also develop habits of following a trading plan and risk management strategies, crucial for long-term success in forex trading.

How to Open a Forex Demo Account

Now that we are familiar with a demo trading account and have understood its advantages, let’s see how to open it and start trading.

Step 1: Choose a Forex Broker

The first step in opening a demo trading account is to select a forex broker that provides these services. There are numerous forex brokers in the market, and choosing a reputable and reliable broker is essential. Factors to consider when choosing a forex broker include regulations, customer support, trading platform, and fees.

It is recommended to research and read reviews before selecting a forex broker. You can visit the Best Forex Brokers page to view the top brokers and become acquainted with them. Separate articles also provide detailed reviews of each broker.

Step 2: Register with the Broker

After choosing a forex broker, the next step is to register with them. The registration process usually involves providing personal information such as name, email, and phone number. Some brokers may require additional verification, such as identity and address verification. Providing accurate and valid information during the registration process is crucial.

Step 3: Download the Trading Platform

In the next step of opening a demo account, after registration, the trader needs to download the trading platform provided by the broker. Most forex brokers offer trading platforms like MetaTrader 4 or MetaTrader 5, cTrader, or their proprietary trading platform. The trading platform is essential as it provides access to market data, charts, technical analysis tools, and the ability to execute trades in real-time.

Step 4: Open a Demo Trading Account

After downloading the trading platform, the trader needs to open a trading demo account. This can usually be done through the trading platform by selecting the option to open an account. The trader needs to provide some initial details such as name, email, and phone number. Some brokers may require additional confirmation before activating the account.

How to Open a Forex Demo Account

Step 5: Start Trading

After activating the demo trading account, the trader can begin trading using virtual funds. It provides access to market data, allowing traders to execute trades just like a real account. It is crucial to remember that virtual funds in this account are not real money, and traders should not expect similar emotions or feelings when trading with real money.

Step 6: Practice and Learn

A trading demo account provides an excellent opportunity for traders to practice and gain knowledge about the market. Traders can experiment with different trading strategies, analyze market trends, and develop their skills without risking real money. Utilizing resources and tools offered by the broker, such as educational articles, webinars, and tutorials, is essential.

Summary

A demo trading account is an essential tool for forex traders at all levels. It offers a risk-free environment for traders to practice, test new strategies, and develop discipline, order, and patience.

By using a demo account, traders can gain experience in the forex market without risking their capital. They can also access a wide range of resources and tools that can assist them in making informed decisions about their trades.

Whether you are a novice or an experienced trader, using this account can help you become a better forex trader. Opening a trading demo account for forex trading is a simple process and can be completed in a few easy steps, as outlined in this article. BrokerLand is here to guide you in this regard. Feel free to share your comments and questions below this article for further assistance.

What is Stop Out Level in Forex?

What is Stop Out Level in Forex?

Forex involves buying and selling various currencies to make a profit. This market is highly volatile, offering both lucrative opportunities and associated risks. Therefore, it is crucial for traders to understand the concept of “stop out level” to effectively manage their risks as they decide to learn forex and start trading. In this article, Brokerland explains the importance and concept of stop out in Forex trading. Stay with us.

Stop Out Level in Forex

Stop out level refers to the point at which a trader’s account is automatically closed by the broker due to insufficient margin. This occurs when the trader’s margin falls below a certain threshold, usually around 20 percent.

The margin level is the equity trader’s ratio to the required margin, expressed as a percentage. In previous articles, we have discussed margin and equity in detail.

For example, suppose a trader has an account balance of $10,000 and is trading a currency pair with a required margin of 1 percent. This means the trader needs to maintain a $100 margin to keep their positions open.

If the trader’s account equity drops to $1,000, their margin level will be 10 percent, which is below the 20 percent stop out threshold set by the broker. At this point, the forex broker automatically closes the trader’s positions to prevent further losses.

Stop out in Forex is a crucial concept as it prevents traders from losing more money than they can afford. By setting stop-out levels, brokers can protect both themselves and their clients from excessive losses.

Stop Out vs. Margin Call

It’s important to note that stop out and margin call are not the same. A margin call occurs when a trader’s margin level falls below a certain threshold, usually around 100%, meaning their equity equals or falls below the margin. When a margin call happens, the broker typically requests the trader to deposit additional funds to meet the margin requirements. If the trader fails to meet these obligations, their positions may be closed by the broker.

On the other hand, stop out is the last line of defense against excessive losses and is designed to protect both brokers and traders. A margin call serves as a warning sign that the trader’s margin level has dangerously fallen, and to prevent reaching stop-out, there is a need to deposit additional funds or close positions.

Stop Out vs. Margin Call

How to prevent it?

Preventing stop out in forex trading involves several strategies that traders can employ to manage their risks and avoid reaching the stop out level. One of the most common strategies is the use of stop-loss orders, which are orders placed at a predetermined price level to limit losses if the market moves against the trader’s position. Stop-loss forex orders can be set below the stop out level, meaning that if the market moves unfavorably, the trader’s trades will automatically close, but before their margin level reaches below the stop-out.

Another strategy involves using proper position sizing. This includes calculating the appropriate trade size or position size for each trade based on the trader’s account balance and risk tolerance. By using an appropriate position size, traders can ensure that they don’t risk more than they can afford to lose in each trade.

Traders can also utilize leverage to manage their risks. Leverage allows traders to control larger positions with less capital. However, as mentioned in the leverage article, it also increases the potential for losses, so traders need to use it wisely and understand the associated risks.

Additionally, traders should be aware that stop out levels can vary between brokers and even among different currency pairs. Some brokers may have higher stop-out levels than others, meaning that traders may be able to accept higher risks with those brokers.

Conclusion

In conclusion, understanding the concept of stop out is vital for forex traders to effectively manage their risks. By setting stop-out levels, brokers can protect both themselves and their clients from excessive losses. Traders can employ various strategies, including stop-loss orders, proper position sizing, and leverage, to manage their risks and avoid reaching the stop out level.

However, it’s crucial for traders to remember that forex trading is a highly volatile market, and there’s always the potential for unexpected market movements that can lead to losses. Traders, with awareness of risks and effective risk management, can increase their chances of success in forex trading.

Forex News Trading | How To Trade The News?

Forex News Trading | How To Trade The News?

Many traders, regardless of the market they trade in, base their decisions solely on technical analysis and price charts, and forex news has no impact on their decision-making process. These traders completely disregard fundamental factors and instead focus on price trends, analyze support and resistance levels, and assess various signals from a technical indicators.

However, fundamental analysis is as important in the modern trading world as technical analysis. The release of important news such as income reports and interest rate changes can significantly affect the markets. Therefore, forex news trading can be very beneficial for traders, and incorporating economic announcements into their strategy can considerably enhance their approach, as you’ll learn in this Forex tutorial by Brokerland. Discover how to trade the news and identify potential trading opportunities in financial markets.

What Are the Most Important Forex News?

To trade the news, you should be familiar with economic indicators, which are macroeconomic factors that influence all financial markets, including forex, stocks, and indices. These can include changes in interest rates, inflation, unemployment rates, or income for a specific country, all of which have a significant impact on financial markets and the overall economic situation.

Economic announcements usually encompass these specific factors when recommending recent changes in the markets, which can influence market sentiment and sentiment analysis, especially if the data doesn’t align with traders’ expectations. Traders usually use them for forex news trading.

Forex News Trading

Forex news trading is a strategy that involves making trades based on market expectations both before and after the news release. Trading on news announcements can compel you to make quick decisions, as financial markets can be almost immediately affected. Therefore, you need to be prepared to make fast judgments about how to trade the news.

Forex News Trading

When trading in the forex market, it is important to be aware of how financial markets operate. Sometimes, news is already priced into the asset’s value. This happens because traders try to anticipate future news announcements, causing the market to react by changing the asset’s price. To trade the news, especially in volatile markets like the oil market, can be beneficial.

The forex news in the market can become active both before and after important economic events. However, there are significant differences between the type of news that distinguishes currencies from other financial markets.

Forex markets mostly respond to macroeconomic news, reflecting or affecting broad economies. Generally, traders can assess economic news to evaluate its impact on interest rates and monetary policy.

Currencies of countries that are major exporters of commodities or goods can be influenced by forex news because it affects the prices of the commodities they produce. These currencies are often referred to as commodity currencies.

Let’s take a look at the supply and demand discussion. On the supply side, news indicating lower supply can drive prices higher, while ones indicating increased supply can reduce prices and may impact related currencies. News that can reflect changes in supply may cover various factors such as political tensions, war, terrorism, weather, economic sanctions, labor relations (strikes), and more. Commodity futures trading and demand pricing are mainly influenced by many of the same major events mentioned above, along with reports and inventory outlooks.

To follow and trade the news, you can use major and reputable websites like Forex Factory, and always try to keep your information up to date. An economic data release typically includes details such as the date, time, name of the economic event, previous result, market expectations or forecasts, and actual data. In addition, in many economic calendars, you can see the importance or impact rating assigned to a specific event (as shown in the image below).

How to trade the news?

How to trade the news?

To achieve a comprehensive trading strategy in forex using important forex news releases, traders look for key forex indicators that can influence interest rate expectations and currency exchange rates. These indicators include:

  • Central bank decisions and speeches.
  • Inflation rates
  • Gross Domestic Product (GDP) figures.
  • Employment figures.
  • Trade balances.

Market sentiment-related news can also affect currency pairs trades, especially those considered safe havens, including gold and major currencies such as USD, JPY, and CHF. These currencies tend to attract capital during times of market turmoil.

The most critical forex news events that can impact risk-on and risk-off trading include stock market returns and volatility, national or continental-level financial stress, political turmoil, elections, treaty negotiations, and other broad news events beyond economic data and central banks. Recent examples include the Greek debt crisis and the Chinese market turmoil.

Predicting Forex News Trading

Traders should understand that demand for many commodities, and consequently their prices, fluctuates with the seasons. Forex news and the effects of seasonal trading are seen in energy and agricultural commodities, but are less noticeable with precious metals. The table below shows some major currency pairs and the commodities they are influenced by. This can be used by traders as a type of forex news trading signal, as it can help predict currency prices.

In conclusion, forex news trading can be a viable strategy, but it requires careful consideration of economic indicators, central bank decisions, and overall market sentiment. Traders should stay informed about important news releases, understand the context in which they occur, and use them as part of their strategy to trade the news.

Country Currency Pairs Influential Commodities
Canada
USD/CAD WTI، Crude Oil, Metals
Australis AUD/USD Base Metals, Wheat
New Zealand NZD/USD Dairy Products
Norway USD/NOK Crude Oil
Sweden USD/SEK Metals, Wood
South Africa USD/ZAR Precious Metals
Russia
USD/RUB Crude Oil, Natural Gas, and Metals

Benefits of Trading News

Let’s talk about the good points that make it popular to trade the news.

It can help increase volatility: Some significant economic announcements can create higher market volatility, even if it’s for a short period. Even the latest Forex or stock chart patterns can temporarily be influenced by a noteworthy trading announcement, such as the latest unemployment news or changes in interest rates or inflation rates by a central bank.

Paying attention to the timing of trading announcements can mean that you are ultimately executing a well-planned and precise trade right before a major event, which can immediately protect your losses. You might have to wait after significant forex news events for new positions to open and then see if the reason for the trade is still valid or not.

Forex news trading can create unexpected market reactions: Usually, among leading economists, there is a consensus on where an economic announcement is likely to end up. Changes in non-farm payrolls, Gross Domestic Product (GDP), or inflation data are some of the most critical Forex news, and they will affect the market.

For example, a low unemployment rate indicates a strong economy, so many expect that the stock market will increase. Decisions to lower interest rates may lower a country’s currency attractiveness and lead to its fall against other global currencies. However, sometimes economic news will be very different from what the market expects, and this can cause a market’s reverse reaction.

For example, if a central bank suggests that a possible interest rate decrease may be on the way but the currency is still increasing, other factors may exist besides the prospect of interest rate changes. This, in turn, can be a strong signal to buy. If the currency doesn’t decline as expected with the anticipation of a decrease in interest rates, strong positive sentiment exists, and that may indicate that the market is buying.

It can indicate trend changes: Many traders try to identify trends based on news in the hope of profit to trade the news. Such trends can be variable within minutes, days, or even months. However, most trends will reverse, and changes in the fundamental economy can be the first sign of a changing sentiment. This gives traders an opportunity to open a position at the beginning of a new trend.

Risks of Trading News

However, there are also disadvantages to forex news trading. In particular, you need fundamental analysis skills to trade the news as you need to know how certain economic announcements can impact your position and the broader financial market.

There is also the risk of holding positions for a more extended period. If the release of news requires days or weeks to happen, your intraday trading positions may remain open for an extended period, which can require you to pay additional holding costs. Therefore, traders need to ensure that they have sufficient funds in their accounts to cover these costs when they decide to trade the news.

Conclusion

In conclusion, forex news trading is a dynamic and high-stakes strategy that offers immense potential for traders seeking short-term profits. By harnessing the power of economic events and staying well-informed about global developments, traders can capitalize on price fluctuations in the currency market.

However, it is essential to approach news trading with caution and employ effective risk management strategies, as the market’s rapid and unpredictable nature can result in substantial losses as well. Ultimately, successful traders requires a delicate balance of market analysis, timely execution, and a thorough understanding of the ever-evolving world of global finance to trade the news.

Forex news trading is a powerful strategy that can offer both significant advantages and potential pitfalls to traders. It has the potential to capitalize on increased market volatility, create opportunities for unexpected market reactions, and provide valuable insights into changing trends.

However, it requires a deep understanding of fundamental analysis, and traders must be vigilant about market conditions, as well as the potential for extended open positions that may incur additional costs.

Forex Leverage Definition. Why is it a Double Edged Sword?

Forex Leverage Definition. Why is it a Double Edged Sword?

Leverage is one of the key features in learning forex and can be a powerful tool for a trader. You can use it to take advantage of relatively small price changes and equip your portfolio or increase your capital. In fact, using this forex leverage increases your capital for trading and taking various positions, even if you don’t have all the capital yourself.

While there is no obligation to use this feature in your trades, and it’s entirely up to the trader’s decision, it can lead to increased profits and losses both. Stay with Brokerland  to fully understand this concept.

What is Forex Leverage?

Leverage, or margin, increases your capital for trading by using a deposit known as margin. Essentially, you pay a portion of the full trade value, and your broker loans you the rest. The capital involved in your trade, compared to your margin, is known as the leverage ratio. In other words, it is using borrowed capital to increase your credit in forex trades and your positions.

For example, suppose you want to buy one lot of GBP/USD at a price of 1.2860. One lot of GBP/USD is equivalent to 100,000 dollars, so buying the base currency without leverage requires an expense of 128,600 dollars (ignoring any fees or other costs). If GBP/USD increases by 20 pips to reach 1.2880, your position is now worth 128,800 dollars. If you close your position, you’ll have a profit of 200 dollars.

What is Forex Leverage?

Benefits of Using Leverage

Forex Leverage can be a powerful trading tool, provided you understand how it works and also consider the associated risks. Here are just a few of the advantages mentioned:

  • Increased Profits: Essentially, you only need to pay a fraction of the trade value but can earn profits based on the full value of the position. Since profits are calculated based on the full position value, margins can magnify your returns in successful trades and, at the same time, your losses in unsuccessful trades.
  • Taking Short Positions: Using it to speculate on market movements allows you to benefit from both rising and falling markets. This is known as taking a short position, or shorting the market, which we will explore in more detail in the future.

Disadvantages of Using Leverage

While it provides a wide range of benefits to traders, it’s important to also consider the potential downsides. Here are a few key points to keep in mind:

  • Large Losses: While it increases a trader’s potential profits, it should be remembered that it also increases potential losses.
  • Margin Calls: If your position moves against you to the extent that your required margin exceeds your account equity, your broker may require you to increase your account balance to keep the trade open.

Leverage and Risk Management

Leveraged trading can be risky, as losses can potentially exceed your initial investment. However, there are risk management tools available that you can use to mitigate potential losses. Using stop-loss orders is a popular method to reduce risk, as it can limit your losses if prices move against you.

However, markets move quickly, and under certain conditions, your stop may not be triggered at the price you set. There are also various other risk management tools available, which we will explore in more detail in future articles.

Leverage and Risk Management

An Example to understand better

Let’s look at an example using numbers. Forex trades are conducted using a standard amount of units called “forex lot” with each lot representing 100,000 units of a specific currency. If your account’s base currency is the US dollar, and you open a standard lot position, you are buying or selling 100,000 units of that currency.

For example, if you have $10,000 in your account and you open a 100,000-dollar position (one standard lot), you are trading with 10 times leverage (100,000/10,000). Similarly, if you trade two standard lots with a total value of $200,000 and your account has a balance of $10,000, your account is utilizing 20 times one (200,000/10,000).

In Forex, traders with only $1,000 can potentially trade up to $100,000. Now, let’s consider a scenario in which a trader has a total of $100,000 at their disposal, and the account value increases to $1,000. In this case, the trader has extended their banking turnover by 1%, which is known as 1:1 leverage – something not typically seen in Forex.

Different brokers in the Forex market offer varying ratios. For example, USGFX offers 1:1000 leverage, while Amarkets offers 1:3000. Keep in mind that the concept of this ratio means that by using such leverage, you can open an account with $400 and execute trades of up to $400,000. It may sound exciting, right?

Final Words

While using leverage in trading can be very advantageous due to the requirement of less capital, it also carries a high level of risk and potential for significant losses. Therefore, it’s crucial to be cautious, monitor your positions, and focus on strengthening your trading strategy to prevent substantial losses.

What is Forex Spread and how to calculate it?

What is Forex Spread and how to calculate it?

Any market you can trade with us has a spread, which is the primary cost of a trade. In fact, there’s always a difference between the buying and selling price of a currency pair, and that’s precisely what this term means.

This difference in rates can sometimes be fixed and sometimes variable and floating, and it’s clear that the fixed type is more popular among traders because it offers more predictability. To understand the meaning of this topic, including what forex spread is, what types it comes in, and how it’s calculated, stay with Brokerland in this article.

What is The Forex Spread?

The forex spread is a small cost embedded in the bid and ask prices of each currency pair transaction. When you look at a price quoted for a currency pair, you’ll see a difference between the buying and selling prices – this is it.

Changes in this price difference are measured in pips with small price movements – each change in the fourth decimal place of a currency pair (or the second decimal place when trading currency pairs involving the Japanese yen) is a pip. It’s not just this that determines the total cost of your trade; the forex lot size is also a determining factor.

Remember, every forex trade involves buying one currency pair and selling another. The left-side currency is the base currency, and the right-side currency is the quote currency (for better understanding, refer to the currency pairs page on the Brokerland website). When trading FX, the bid price is the cost to buy the base currency, while the ask price is the cost to sell it.

What is The Forex Spread?

How to Calculate Spread in Forex

To calculate this value in forex, you need to find the difference between the buying and selling prices in pips. You do this by subtracting the bid price from the ask price. For example, if you’re trading GBP/USD at 1.3089/1.3091, the spread is calculated as 1.3091 – 1.3089, which equals 0.0002 (2 pips).

Forex spreads can be either wide or narrow – the more pips you get from the above calculation, the higher this value is. Traders often prefer narrower values because it means more cost-effective trading.

If a market is highly volatile and lacks liquidity, the rate difference between buying and selling is likely to be higher, and vice versa. For example, major currency pairs like EUR/USD will have narrower ones compared to pairs in emerging markets like USD/ZAR. However, depending on the factors explained below, these values can change.

Types of Forex Spreads

Forex brokers offer various types of trading accounts, and to find the best ones, you can visit the Best Forex Brokers page for a better understanding. Brokers always provide different types of accounts with various spreads, which is one of the criteria for traders when selecting a broker. For example, this amount at Alpari Broker may differ in various accounts compared to Amarkets. These rate differences are classified into two categories:

  1. Brokers with Fixed Spreads
  2. Brokers with Floating Spreads

Let’s delve deeper into the concept of these two types.

Types of Forex Spreads

Fixed

The difference in a fixed forex spread is constant and does not change with the time frame or market fluctuations. However, when market liquidity is low or there is significant market volatility, there may be temporary changes in the rate.

In such cases, when the market returns to its normal conditions, this amount also returns to its normal value. It’s clear that trading with a fixed type is more comfortable and profitable for traders because it is more predictable and carries lower risk.

Increased competition in recent years has led brokers to constantly strive to offer new features to their users, and these innovations are related to the spread difference. This has led to an increase in the number of brokers offering floating types of it.

Floating

In contrast to fixed forex spreads, floating types in forex are constantly variable. This means that the difference between the buying and selling rates is continuously changing. The difference in floating ones mainly reflects the interbank market and, to a large extent, represents interbank communications.

For this reason, some brokers offer trading accounts with floating spreads as ECN (Electronic Communication Network) accounts. In this platform, banks, market makers, and investors trade together in a system where they have lower forex spreads and, at the same time, pay their own commissions to the broker.

Why Does the Forex Spread Change?

As mentioned above, when the difference between the buying and selling prices of a currency pair changes, it is called a variable spread, unlike the fixed type. When trading in forex, you are always dealing with variable ones.

If there is significant news or an event that leads to increased market volatility, it is possible for this amount, or the difference between the buying and selling prices of a currency pair in forex, to widen. One of the drawbacks of the variable type is that if this is significantly widens, your positions may be closed, or you may face a margin call.

Summary

In this article, we discussed another basic term in the forex market that you need to know as you begin to learn forex. In summary:

  • A forex spread is the initial cost of a currency trade embedded in the buying and selling prices of a currency pair.
  • This value is measured in pips, which is a movement in the fourth decimal place in the forex pair (or the second decimal place in the case of JPY currency pairs).
  • To calculate it, subtract the bid price from the ask price.
  • They can be wide or narrow.
  • Traders often prefer narrower ones because it means more cost-effective trading.
  • If a market is highly volatile and lacks liquidity, this amount may widen.
  • If a market has high liquidity but is not very volatile, it may be narrower.
  • Factors such as significant news announcements or events that increase market volatility can lead to changes in the forex spread.
Margin Definition How to calculate forex margin

Margin Definition ❤️ How to calculate forex margin

Every forex trader needs to understand margin and its requirements. Typically, when opening a position, a portion of your capital is set aside as a deposit, which acts as collateral to cover the risk associated with the trade. Here, BrokerLand website will explain anything you need to know about forex margin and calculate it.

What is Margin in Forex?

In the context of forex trading, margin or capital level is simply a portion of your account balance that is temporarily set aside when executing a trade. This amount is often displayed as a certain percentage of the full position size: 0.25%, 0.5%, 1%, 2%, and so on.

The maximum leverage, or leverage ratio, that can be used in your trading account can be calculated based on the requirement of your forex broker. You can explore different types of brokers like RoboForex, Alpari, LiteForex, Windsor, Orbex and INGOT on the broker review page and get acquainted with their specific terms and conditions. Understanding this consept is essential for managing your risk and capital effectively in the forex market.

Forex Margin Level Explained

The margin level is a state in forex brokers that typically indicates that the available balance in an account has decreased. When this happens, an investor can choose to deposit more funds or sell some of the assets in the account, effectively closing open positions. By doing so, the account is brought back to its minimum required level.

Margin level refers to the health of an individual’s trading account. Expressed as a percentage, it represents the equity-to-margin ratio used by open positions in the forex market.

Stop Out at a Low Margin Level

In forex trading, a stop-out helps minimize losses in your account. When the margin-to-equity ratio reaches a certain percentage (typically 50%), as you no longer have enough amount of it to support your open positions, the positions are forcibly closed. This is often referred to as “stop out” or “automatic liquidation” of positions.

Stop Loss Order for Capital Protection

A stop-loss order, also known as a stop order or a market order, is one of the Forex orders and means that a broker will close a position when the respective currency pair reaches a specific price point, limiting the trader’s loss.

Stop-loss orders are typically used when opening long positions, but they can also be used as protection for short positions. They serve as a risk management tool to limit potential losses by automatically closing the position when the price moves against the trader’s position to a predetermined level. This ensures that the trader doesn’t suffer larger losses than they are willing to accept.

Stop Loss Order for Capital Protection

Why Margin Calculations Are Important

Margin calculations in forex represent a deposit that a trader puts up as collateral to ensure a position. Think of it as a deposit; it’s not a fee or cost, but it ensures that your account can manage any trades you undertake.

The margin you need to post is entirely dependent on the size of the trade you’re making. It’s essential not to over leverage, as excessive amount can lead to significant losses. Trading on margin in forex is a significant reason why stock traders experienced massive losses during the 1929 market crash. When trading forex, it’s crucial to keep this in mind.

The formula for calculating forex margin  is straightforward. You simply multiply the size of the trade by the percentage of your equity. Then, subtract the amount of it used for all trades from the remaining equity in your account. The result is the amount that remains. Proper management in this area is critical to protect your capital and avoid unnecessary risks in the forex market.

Margin Calculation

Forex Margin calculations in trading are crucial for determining the amount of capital needed to secure a position. The requirement amount of it is based on the size of your trade, but it can be more complicated when the base and quote currencies in your trade differ from the currency in your account. Here’s how to calculate the requirement for such cases:

Let’s assume you decide to trade GBP/JPY with your account in USD. You decide to take a position with 10,000 units of the base currency. In this case, you’re effectively buying 10,000 pounds, but in reality, you’re using USD to buy GBP. As far as your forex broker is concerned, the margin requirement is calculated based on the USD, which is your account’s primary currency.

If you don’t have access to a calculator, here’s the formula you can use to calculate the required amount in the currency of your account:

Required Margin = ([Base Currency ÷ Account Currency] ✕ Units) / Leverage

For the GBP/JPY trade example:

Base Currency = GBP
Account Currency = USD
Quote Currency = JPY
Base Currency / Account Currency = Current exchange rate of GBP/USD (e.g., around 1.30 at the time of writing this article)
Units = 10,000

To apply this calculation to another example using EUR/USD, with a current exchange rate of 1.21773, if you were to purchase 500,000 units (five standard lots) with a standard of 30, you would need $20,295.50 in your account to open this position.

Here’s another example with different assumptions. Suppose you’re buying one standard lot (100,000 units) of GBP/NZD, but your broker requires a 20x margin. The current exchange rate for this currency pair is 1.90187. So, the calculation would be 100,000 units ÷ (20 ✕ 1.90187), which amounts to $9,509.35 or $7,010.96 USD as the required amount for executing this purchase.

While learning how to do these calculations manually is essential, you can also use a calculator to speed up these computations and double-check your work.

Margin Calculation

The Impact of Leverage on Forex Margin

Leverage, often expressed as the capital ratio, can vary from one broker to another. A common value for leverage is 30:1. As mentioned in the first example above, for a trade size of 10,000 units, you would need to calculate this amount as (1.3 * 10,000) / 30, which equals $433.33.

In the third example, where a leverage of 20:1 was specified, the higher leverage reduces the capital ratio and potential profit while providing an opportunity for profit well beyond what traditional trading could offer.

Hence, determining how changes in each of these values can affect your requirements is straightforward. Increasing the leverage to 50:1 instead of 30:1 decreases the required margin to $260. However, it also means that potential losses are 67% higher relative to your current assets.

What’s the Relationship Between Leverage and Required Margin?

A lower requirement might seem more attractive as it allows you to hold the same position with less money. However, you need to be cautious because a profitable trade means you’ll earn more income, while a bad trade means increased losses.

Less capital means more inherent risk. When traders fail to account for the implications of using forex margin, they might incur significant losses before realizing what’s happening to their accounts.

Higher leverage means your margin call is delayed, but it also means you’ll lose more money. Understanding which values are more effective is a part of forex trading, and knowing the right balance comes with experience.

What is Maintenance margin?

Maintenance margin, is the minimum amount that a trader must keep in their account after opening a position. Currently, this amount is typically 25% of the total margin account value. It helps protect brokers and creates a buffer between the funds issued and the trader’s margin account value, reducing the risk assumed by a broker, especially when market prices are falling rapidly.

The Advantages and Risks in Margin Trading

Like any trading opportunity, this kind of trading has its own set of unique risks and rewards, although the risks and rewards can be amplified through this trading strategy. Here, we’ll take a look at some of the pros and cons:

Advantages:

  1. Margin allows you to potentially earn much higher profits compared to a standard account.
  2. It can help grow your account faster.
  3. Experienced traders who can evaluate trades and make decisions quickly may benefit from it.

Risks:

  1. These trades can carry high levels of risk and may expose your account to significant losses due to the large trade sizes.
  2. Traders using leverage might experience high levels of stress due to the consequences of their trades.
  3. You may be subject to a margin call, requiring you to deposit more funds into your account or sell some of your assets to free up capital as collateral for your open positions.

Conclution

Given the significant importance of the margin discussion in Forex, this Brokerland forex learning article has endeavored thus far to fully address related matters. Whether in part-time trading, prop trading, or any method from expert advisor to various analytical techniques and using Forex signals, available resources for trading in this market, a complete understanding of margin in Forex and protecting one’s capital. Share your thoughts below this article with us, and if you have any questions regarding this topic, write them here so we can guide you.

Currency Correlation How to Trade Using Forex Correlation

Currency Correlation ❤️ How to Trade Using Forex Correlation

The term “Currency Correlation” refers to the correlation between currency pairs in the Forex market. It is a statistical measure of the relationship between the values and movements of these currency pairs. When two pairs move up simultaneously, it’s considered a positive correlation. On the other hand, if one goes up while the other goes down, it’s a negative correlation.

Understanding and monitoring the correlation between currency pairs is crucial for Forex traders, as it can impact their risk level when trading in the Forex market. This article by Brokerland explains how to determine and calculate Forex correlations, their influence on trades and trading systems, and the tools used to track correlations between currency pairs.

Key points:

  • Forex pairs can move together with a positive or negative correlation.
  • The correlation coefficient formula indicates the strength of their connection.
  • Readings below -70 and above 70 are considered strong, while readings between -70 and 70 are considered weaker.
  • Commodities can also have correlations with each other and with Forex.

What is the currency correlation in Forex trading?

Currency correlation is the relationship between two currency pairs. When two pairs move in the same direction, it’s called a positive correlation. When they move in opposite directions, it’s a negative correlation. If the pairs move randomly without any discernible relationship, there is no correlation. Negative correlation can also be referred to as an inverse correlation.

Understanding the correlation between currency pairs is crucial for traders as it can directly impact the outcomes of Forex trades. For example, imagine a trader purchasing two different currency pairs that have a negative correlation. Profits in one pair might offset losses in the other, often used as a hedging strategy.

However, buying two correlated pairs can double the risk and profit potential since both trades will result in either gains or losses.

What is the Forex Correlation coefficient between currency pairs?

The correlation coefficient indicates how strong or weak the forex correlation between two pairs is. It’s expressed as values ranging from -100 to 100 or -1 to 1, with decimals denoting the coefficient.

If the coefficient falls within the range of -100 to -1, it means the pairs move in nearly opposite directions. Conversely, a coefficient above 100 suggests that the pairs move almost identically in the same direction.

If the forex correlation coefficient is below -70 or above 70, it is considered a strong correlation, as the movements of one pair largely mirror the movements of the other. On the other hand, coefficients between -70 and 70 indicate weaker correlations. Coefficients close to zero imply that both pairs have little to no relationship or currency correlation with each other.

The formula for calculating the correlation coefficient:

While the formula for calculating the correlation coefficient of currency pairs in Forex may seem complex, the general concept is to take data points from two currency pairs and compare these values to the averages of the data points for those currency pairs. The top part of the equation represents covariance, and the bottom part represents standard deviation.

currency correlation coefficient formulaFor example, consider data points as closing prices for each day or hour. The closing price of currency pair X (and Y) is compared to the average closing price of currency pair X (and Y). This allows a trader to input closing values and averages into the formula to extract how these pairs are moving together. To obtain the average, you need to track multiple closing prices using a program like Excel. When multiple closing prices are recorded, you can determine an average that continuously updates as new prices are entered.

Forex Correlations in Currency pairs

The table below displays the currency correlations between some of the traded currency pairs worldwide. You can compare each currency on the y-axis with the currencies on the x-axis to see how they correlate with each other. For example, the forex correlation between EUR/USD and GBP/USD is 77, which is quite high. This table provides valuable information for traders looking to understand how various currency pairs move in relation to each other in the Forex market.

Forex Correlations in Currency pairs

While currency pairs don’t always move in the exact same direction, they tend to move together most of the time. For example, GBP/USD and EUR/GBP have a strong negative correlation of -90, meaning they often move in opposite directions.

Monitoring currency correlations is crucial because, even in this small table of currency pairs, there are several strong correlations. A trader might unintentionally buy GBP/USD and sell EUR/GBP, assuming they have different positions. However, since these pairs have a high negative correlation, they are known to move in opposite directions. Therefore, the trader is likely to end up either winning or losing on both positions, as the trades are not entirely independent.

What does it mean for Forex currency pairs to be uncorrelated?

Currency pairs are considered uncorrelated when they move independently of each other. This can happen when the currencies involved in each pair are different and are influenced by different economies.

For example, both EUR/USD and GBP/USD contain the US dollar, and the Eurozone and the UK have economies that are somewhat similar. Therefore, they tend to move together, though not always. However, EUR/JPY and AUD/USD have no similar currencies. In fact, the Eurozone, Japan, Australia, and the United States all have distinct economies. Consequently, the forex correlation between these pairs is lower.

Forex Correlation Indicator in MetaTrader 4

There isn’t a default currency correlation indicator in the MetaTrader 4 trading platform. However, you have a wide range of downloadable indicators available in the Market and Code Base sections of the platform. These are often created and shared by third-party users, so some indicators may be more effective than others.

Some of these indicators are free, while others may come at a cost. You can filter indicators by name, so by typing “correlation” in the Code Base section, you’ll often find relevant add-ons. These indicators can be easily installed on the MT4 platform.

Summary

In this article to learn forex trading, one of the most basic topics, the forex correlation, was explained. There are other types of correlation, such as the correlation of the dollar and oil prices in Forex, which have been discussed in other articles and you can read it, too.

What is a Forex Trend? Types of Trend in Forex

What is a Forex Trend? Types of Trend in Forex

The Forex trend is the direction of an asset’s price over a specific period. They apply to all assets and markets, such as foreign exchange, commodities, stocks, and bonds, where prices and trading volumes fluctuate. In this tutorial from Brokerland, after understanding what a trend in forex is, you will become familiar with different types of them.

So, what exactly is a trend in forex, and how can you use these types of trends to your advantage? Let’s start by looking at the definition of it and how it can determine your trading strategy.

A market trend is defined as the price direction of an asset within a specific period. When an asset or market experiences an overall price increase during a specific period, it’s in an uptrend, often called a bullish market. Conversely, when the price of an asset is moving downward, it’s said to be in a downtrend or a bearish market. They help traders and investors in analyzing them and identifying trading opportunities.

What Is a Forex Trend and How Does It Work?

To understand what a Forex trend is and become familiar with different types of them, it’s important to consider the factors that can influence the formation of a trend in forex.

  • Government Policies

Governments can either slow down or accelerate market growth by using fiscal and monetary policies. For example, central banks’ adjustments to interest rates can impact a country’s economic growth and have a direct effect on cyclical and defensive sectors.

  • Market Sentiment

Forex trends can be shaped based on market sentiment. When traders and investors have faith in the direction of a country’s economy or a company’s business outlook, their optimistic attitudes can create an upward trend in forex. Conversely, negative market sentiments among traders can lead to a decline in asset prices.

  • Supply and Demand

Asset prices tend to fluctuate due to changes in the dynamic between supply and demand, particularly relevant for commodities. For instance, when an economy is thriving, the demand for crude oil increases, causing oil prices to rise. Conversely, events like wars and mining disruptions can limit the supply, resulting in price hikes.

  • Economic News

Positive corporate earnings reports or upbeat economic news that exceeds expectations can all contribute to an upward trend. Conversely, negative news can bring down prices and create a downward trend in forex.

Types of Trend in Forex

There are various types of forex trends depending on their duration and driving factors.

Types of Trend in Forex

1. Secular Trend in forex

Secular trends can last for years or even decades. They often result from structural changes in the economy and population. For example, the current shift toward sustainable energy is considered a secular one.

2. Primary Trends

Primary forex trends can last from several months to several years. They are guided by changes in the business cycle as well as political and economic events. For example, the Federal Reserve’s monetary tightening cycle can be considered a primary trend.

3. Intermediate Trends

Intermediate trends can last from weeks to months. They are typically defined by changes in investor sentiment and technical factors.

4. Minor Trends

Minor trends can last for a few days or less. These short-term ones often take shape due to current news and trading volume changes.

How to Identify Trend in Forex?

Market trends can be identified using both technical and fundamental analysis. Popular technical analysis tools like trendlines, price action, Relative Strength Index (RSI), and Moving Averages are commonly used by traders.

  • Trend lines

A forex trendline is a straight line that connects a series of price points, typically lows, extending into the future. An ascending trendline connecting a series of low prices establishes a level of support for future price changes. Conversely, a descending one connecting a series of low prices indicates a level of resistance.

  • Relative Strength Index (RSI)

The RSI indicator measures the speed and magnitude of price changes to determine whether a security is overbought or oversold. An RSI reading of 30 or lower indicates that the market is oversold, while a reading of 70 or higher indicates overbought conditions. Both readings suggest a potential trend reversal.

  • Moving Averages

Moving Averages are used to smooth out price action and identify clear market trends amidst market noise. There are two main types of moving averages:

  1. Simple Moving Average (SMA): This calculates the average of prices over a specified time period in the past, such as a 20-day, 50-day, or 100-day SMA.
  2. Exponential Moving Average (EMA): This is a weighted average that gives more emphasis to recent price data, making it more responsive to new information. EMAs are also used to identify support and resistance levels and overall price trends.
  • Fundamental Analysis

Investors can also use fundamental analysis to identify a trend in forex by examining changes in a company’s financials. For example, when a company consistently records positive profit growth for several consecutive quarters, it indicates a positive market trend. On the other hand, when a company’s profits continually decrease over a specific period, it indicates a negative trend in the market.

Forex Trend Trading

The next question is how to trade based on market trends and how it works. When the price of a market or an asset is rising, traders typically believe that the increase will continue as long as there are clear signs indicating a decrease in price. When the price falls below the trendline or technical indicators turn bearish, the upward movement may come to an end.

Traders following trend-based strategies focus on buying while the price is increasing and selling when forex indicators suggest a trend reversal (i.e., when the price starts to decrease).

Summary

In this Brokerland article to Learn Forex, we have explained what forex trends are and introduced different types of them. Trend in forex can be a useful tool for strategies. Remember, your final decision to trade should be based on risk tolerance, market expertise, portfolio size, and your unique circumstances. Always do your research before trading, and never trade with money you cannot afford to lose.

What is a Lot in Forex? The Forex Lot Size

What is a Lot in Forex? The Forex Lot Size

To trade currency pairs, you need to understand the concept of lot in Forex. This article from Brokerland explains what Forex lots are, why they are important, and how you can use them to calculate the size of your trades or position.

What Is Lot in Forex?

A Forex lot is essentially a unit of measurement that standardizes the volume of a trade. Changes in the value of one currency in comparison to another are measured in pip in forex, which are the fourth decimal point and thus a very small measure. This means that trading a single unit is not practical. Lots in forex were introduced to enable individuals to trade these small movements in larger categories.

The value of a lot is determined by a broker or a similar market regulator, ensuring that each individual knows how much of an asset they are trading when they open a position.

Lots come in four standard sizes: standard, mini, micro, and nano, providing traders with more control.

Understanding Forex Lots with Chocolate Boxes

Imagine a company selling chocolate boxes in two sizes: 12 and 24. These are standard sizes that consumers and buyers expect. They don’t typically expect to buy just one chocolate from the box.

In the case of Forex currency pairs, it’s the same. You can’t just buy a single unit of currency; instead, you buy a certain amount in a lot in forex. Lots are standard sizes recognized globally. For example, you can purchase 100,000 units of the GBP base currency for the GBP/USD currency pair. This is a standard amount. On the other hand, you can buy a micro lot of 1,000 pounds.

Forex Lot Sizes

So, how much is a Forex lot? It depends on whether you are trading a standard, mini, micro, or nano lot in forex. Forex trades are divided into these four standard measurement units to calculate minor changes in the value of a currency.

The following examples all relate to the EUR/USD currency pair, which compares the Euro (base currency) to the US Dollar (counter currency). For context, if you buy EUR/USD, you are speculating that the Euro is strengthening against the Dollar. If the current exchange rate for the counter currency is 1.3000 dollars, it means you can exchange 1 Euro for 1.3000 dollars. In other words, you need 1.3000 dollars to buy 1 Euro.

Forex Lot Sizes

Standard Lots

A standard lot in Forex is equal to 100,000 currency units. This standard unit size is used by both independent and institutional traders.

Example:
If the EUR/USD exchange rate is 1.3000 dollars, one standard lot of the base currency (EUR) will be 100,000 units. This means that at the current price, you would need 130,000 counter currency units (USD) to buy 100,000 units of Euro.

Mini Lot in Forex

A mini lot in Forex is one-tenth of a standard lot. This means that a mini lot is worth 10,000 currency units. The size of a mini lot implies that the profit and loss effects are less compared to a standard lot.

Example:
If the EUR/USD exchange rate is 1.3000 dollars, one mini lot of the base currency (EUR) will be 10,000 units. This means that at the current price, you would need 13,000 counter currency units (USD) to buy 10,000 units of Euro.

Micro Forex Lots

A micro lot in Forex is one-tenth of the size of a mini lot, which means it’s worth 1,000 currency units. Movements of one pip result in a cash fluctuation of 0.01 currency units, for example, 0.01 Euro if you are trading with the Euro. Micro lots also require less leverage or margin, so a small pip movement has a smaller financial impact compared to larger lot sizes.

Example:
If the EUR/USD exchange rate is 1.3000 dollars, one micro lot of the base currency (EUR) will be 1,000 units. This means that at the current price, you would need 1,300 counter currency units (USD) to buy 1,000 units of Euro.

Nano Lot in Forex

A nano lot in Forex is one-tenth of the size of a micro lot, or 100 currency units. A one-pip movement with a micro lot results in a price change of 0.01 units of the base currency you are trading, for example, 0.01 Euro if you are trading with the Euro.

Example:
If the EUR/USD exchange rate is 1.3000 dollars, one nano lot of the base currency (EUR) will be 100 units. This means that at the current price, you would need 130 counter currency units (USD) to buy 100 units of Euro.

How to Calculate Lot Size in Forex

You typically don’t need to manually calculate lot sizes in Forex because your trading platform should provide you with the necessary information. When you trade, it should be clear which options are available – standard, mini, micro, and nano lots – and which lot size you are using. You can calculate the overall position size by multiplying the lot size and the number of lots you’ve purchased.

Selecting the Forex Lot Size

To choose your lot size, consider the level of risk you’re willing to take. The larger the Forex lot size, the more money you need to invest, and it requires higher leverage. Additionally, each pip movement becomes more significant.

The monetary value of a single pip movement for each lot size, assuming you are trading EUR/USD, is as follows:

  • Standard Lot = $10
  • Mini Lot = $1
  • Micro Lot = $0.10
  • Nano Lot = $0.01

Keep in mind that the value of the currency pair in relation to the base currency in the currency pair you’re trading will affect the calculation. As you can see, smaller Forex lot sizes have a lower cost for each pip movement. This means that you can incur lower expenses by trading smaller lots.